Hi everybody.
This will be a relatively short article but hopefully interesting for all the people involved with driving simulation or simply interested to it.
As the title already says, today i would like to briefly show and discuss some pictures related to one of the latest driving simulation projects i am working on. The project is not ended yet and the model is not 100% finished as well (or, to be precise, it is more or less finished in its base configuration but i would like to add more setup options for the benefit of the final user and these options are not it yet), but since it already shows good promise, i though i could show some pictures here to underline, once again, how close to real car performance you can go with a cheap commercial software like rFactor.
I will not go into the details of each graph this time and, for confidentiality reasons, i had to cover the y-axis scale of each plot, not to discover to many sensible information. I know some people don’t like it, but that’s the only acceptable way here. You will have to trust my intellectual honesty!
The car in question is an LMP3 prototype. I am building a vehicle model of this car for a team that would like to support their drivers training with some driving simulation hours.
The information available about the car are not yet complete and detailed as they were for the F3 model i used for my previous “How close is close enough” article (where i really new each detail about the car), but still complete enough to have a very good matching at the very first attempt. Together with the team, we are anyway working to find or measure all the data that are still missing and we would need to have.
Good enough, we have pretty good figures about what the guys have used until now (and, in any case, how the car was configured for the session we will use as a reference) in terms of setup, aerodynamics (although not as detailed as for the lmp2 project, for example), gear ratios etc. and about how the car looks like in terms of basic dimensions, mass distribution, suspension geometry. In a few words, the vehicle model is, relatively to this session, pretty accurate already.
As you will see looking at the pictures below, the results are already pretty good.
Next step will be collecting data also about other configurations that the team have not yet completely tested (see different aerodynamics configurations in term of wing angles, just to mention an example), but the base seems to be already pretty well established. This should make the vehicle model usable in a predictive way, to test upfront solutions they may want to use for the next race for example (at least in terms of basic things and driver preferences).
One of the most difficult areas, as always is the tires modeling.
The information the team had about them were not as detailed as the ones i had at my disposal working on the lmp2 model, for example.
We had anyway pretty good data about vertical stiffness, rolling radii and gearing effects.
For all what concerns tire forces, on the other hand, i am heavily relying on the experience i gained with LMP2 tires, which are anyway pretty similar to the LMP3 ones.
As i stressed a lot in my previous article, every simulation is nearly useless if the data we input are not accurate or even wrong, no matter how good the source code is.
Having trustable data is a key point; although then, of course, who creates the vehicle model should anyway know very well how to input this data correctly into the software and, if we speak about rFactor, this means knowing well enough the equations lying behind each subsystem model.
Unfortunately, as we already said, getting good data is sometimes very complicated. Sometimes this data doesn’t exist at all (you would be surprised to see how many teams, even at pretty high level in motorsport, don’t have or didn’t received data about their car from the manufacturers), sometimes it is very confidential and nobody really wants to share it.
In situations where you don’t get all what you want (and, in certain areas, you normally don’t get what you want!), experience can play a big role, both in understanding and estimating how certain components/systems could behave or relying on previous projects to model some of the components behavior, without having direct measurements about them.
A few word about the car. LMP3 vehicles are pretty interesting, although much simpler and slower than an LMP2. They have a reasonable amount of downforce, pretty good tires (although basically standard gt rubber) and they show a very interesting cost/performance ratio. That´s probably the most appealing aspect.
The cars are pretty slow, probably also compared to what the regulators expected, but there are some explanations (see a not too powerful engine) and probably also a pretty big margin for improvement. I am curious to see what will happen, also in terms of performance, as soon as other manufacturers will join the championship.
Let’s take a look to some plots now. As i said, i will not comment them into details, but i think, also basing on my previous article, they are pretty self explanatory.
The data (both virtual and real) refers to a lap in Imola. The virtual track is not perfect but, compared to other ones you could find on the internet, is pretty good. Track accuracy is very often one of the bottle necks to produce similar comparisons.
It is not easy to find detailed and correctly modeled tracks, so i guess tracks modeling itself is maybe so easy. That is somehow sad, since most often, also if you have enough data to validate the model you create, you cannot make a 1:1 logged data comparison, because the virtual track is too different from the real one.
In similar situations, i normally rely on a performance envelope validation (comparing for example real data to virtual one with the vehicle driving in corners with similar radius, or comparing straight and braking speed envelopes separately, etc).
This is, partially, actually better than just using only a full lap comparison and this is a face i normally follow anyway at the very beginning of the modeling face, mainly using the tools i built up in excel.
A logged data comparison is, anyway, somehow more direct and easier to understand also for the final users and that´s why it could be cool to have access to laser scanned tracks, for example.
The first plot we will look at is the vehicle speed. Real data are always the blue trace, simulated data are the red one.

As we may see, the two traces match pretty well. There are of course some differences, including some misalignment connected to the track lengths (or, more precisely, to each track segment length), especially at the end of the lap.
In any case, the speed traces are pretty close with the main differences being in fast corners, although we still talk of pretty limited mismatches.
The reason could be, here, a slight overestimation of the downforce the car can produce, but we have to keep in mind that a driver seating in a simulator will always take more risks than what he is doing in his real car; first of all because there is no risk of any injury, or any bill to pay if you destroy the car; also, in a virtual environment, there is the possibility to try and try and try again the same track, improving every lap. In championships like LMP3, a driver has to divide his car with other drivers and this reduce his available seat time pretty significantly. Finally, driving in a simulator a fast corner is for sure less physically demanding than doing the same in a real race car, no matter how good your hardware is.
Also, one often underrated reason behind speed differences in some part of the tracks (beside, sometimes, layout or corner radii misalignment), is that a real track is changing its conditions pretty much continuously, including different level of grips just a bit out the “ideal” line, where many debris normally lie. Sometimes, this pretty much dictates where the driver has to put his wheels, also when the geometric ideal line could be another.
All of this cannot be (accurately) reproduced in a driving simulation environment and, actually, we don’t want to, since what the drivers and engineers usually look for when using a simulator is repeatability.
Let´s now look to the following plot, lateral acceleration.
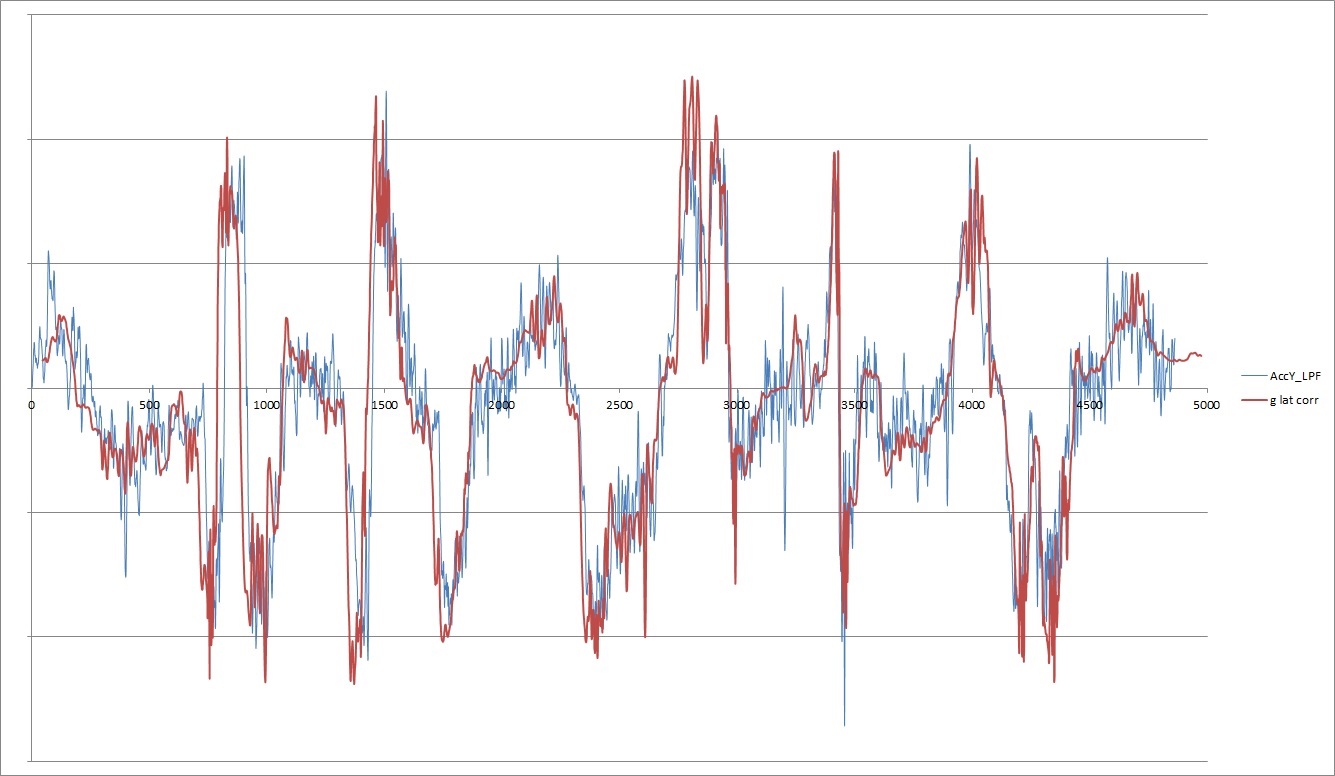
Again, the match is pretty good, a part from track misalignment in certain zones. Small differences are again visible in fast corners, maybe depending also on the driving line the virtual and the real driver had chosen. But i still think the results are pretty promising.
The same can be said about the longitudinal acceleration:
 Unfortunately, the real trace is very very noisy, so you will have to extrapolate a kind of middle line to really compare this data. The trend is anyway pretty good, with the same match tendency already shown by the speed trace.
We can finally take a look to the RPM plot:
 This latest graph confirms, on one side, the right engine and drag forces behavior and, on the other side, also that the rear tires rolling radius and circumference are constantly correct both at high and low speed (so with both low and high downforce compressing the tires and both high and low centrifugal tire expansion).
Again, if you consider how cheap the investment for such a software is, it is pretty amazing to see how accurate the results you could obtain are.
Also, i am more and more convinced about how useful an rFactor based simulator could be, at least for driver training. It is not a case, i guess, if many professional simulation centers use it as a base for their business.


Hi, quick question, what driving software is this for? I want to clarify, this is not real driving data versus a lap simulation, correct?
By: fpaccoret on August 27, 2015
at 4:40 pm
I used rFactor (1) for all of my studies.
It is a cheap and now not so new driving simulation software made by ISI.
The good thing about it is that it is completely open and you can create your own vehicles and track inside it and that is where I and many other people are taking benefit of.
The data you see is real driving vs rFactor simulation.
By: drracing on August 28, 2015
at 6:20 am
How would lap simulation data compare to your driving sim? Can you show me a curve of beta versus distance traveled?
By: fpaccoret on August 28, 2015
at 8:50 am
I guess, with Beta you mean the Body Slip Angle, as i was assuming in my post about Yaw Moment Diagrams.
I own no laptime simulation software, so i cannot publish anything like what you ask. Sorry.
By: drracing on August 28, 2015
at 8:58 am