Hi guys,
this entry will be a bit of a “back to the future” moment, as I will try to analyse the first 2023 WEC Race in Sebring, basing on the publicly available data and focusing only on the top class.
It’s a long time since analyzed a race here, but the new era that started in Sebring for the Hypercar class, with the convergence of LMH and LMDh regulations and seven different manufacturers competing against each other in the top class has provided enough motivation to try and look into the numbers.
The class is surely one to watch, with the like of Toyota, Ferrari, Peugeot, Cadillac and Porsche fighting each other for victory. Particularly interesting, the cars taking part respond to slightly different rulesets.
LMDh vehicles comply to IMSA regulations and are based on chassis provided by four manufacturers (Dallara, Oreca, Ligier and Multimatic) that OEMs can use to attach their own powertrain and create styling cues of their production cars. Those chassis will also for the based for the still-to-be-born future LMP2 class.
These cars are RWD only and have an hybrid powertrain where the electric system (producing a maximum of about 50 kW) being a spec part and is produced by Bosch.
LMH cars, on the other hand, are developed from scratch by each competitor; they are free to design and build each small component of their car as the please, as long as they respect the ruels, and can (but must not) use an hybrid system on the front axle, thus making the cars “part time AWD”. The front electric motor can produce a maximum of 200 kW. To balance LMH cars more fairly against LMDh vehicles, the electric motor can transmit torque to the front wheels only above 190 kph, with the only exception for Peugeot (also because of their tyres, see later) that can profit from a AWD powertrain above 150 kph.
Non hybrid cars can be employed too: in that case, the powertrain can only drive the rear wheels.
To balance the two different concepts and keep the performance of the cars in a given window, the rules needed to be pretty complex, as one could expect, despite said performance being actually significantly lower than what the old LMP1 cars could produce.
The power at the wheels at any time must be below a given curve, that is provided by the rules and can be adjusted up or down, and with the maximum power moving between 480 kW and 520 kW (maximum reference power 500 kW).
The aerodynamics of the cars is also tighly regulated and downforce and drag must be inside specific windows, defined basing on the drag in end-of-straight like conditions and an weighted average of the downforce map.
The tyres are produce by Michelin and are the same for everybody. All cars except Peugeot use 29/71-R18 front tires and 34-71/R18 reear tires, while the French team was allowed to employ 31/71-R18 tires all around, because from the beginning the developed their car around a choice and a late change would have been too complex.
Minimum weight must be above 1130 kg without driver and fuel, but many of both LMH and LMDh cars have been given a higher minimum weight for the first races of the season.
Despite being much slower and (hopefully) cheaper and less technologically complex than the old LMP1 beasts, the hypercars have surely still caused some headaches to the engineers working on them, because the rules still leave enough room for “optimization”. Looking at the aerodynamics, for example, as the performance are tighly regulated, some teams underlined how their effort was focused on producing a car with a big driveable window as possible.
Beside this, as the downforce is regulated in the form of an average over the aeromap, one could think efforts have also been spent on exploting the regulations in the best possible way, maybe by having region of the map where the DF is higher, accepting to be penalyzed in other regions to counteract.
Sebring
The race was won by Toyota, who produced a 1-2 in dominant fashion. Ferrari had suprised the field by taking the pole position in qualifying, but had both less pace and some mistakes compromising any chance of victory during the race. They italian team still finished third at their debut on a very special and demanding track.
Sebring is indeed a special place, extremely bumpy, with a mix of asphalt and concrete surfaces and a combination of low, medium and high speed corners. The 6019 meters long track was divided as usual in three sectors, as shown below.
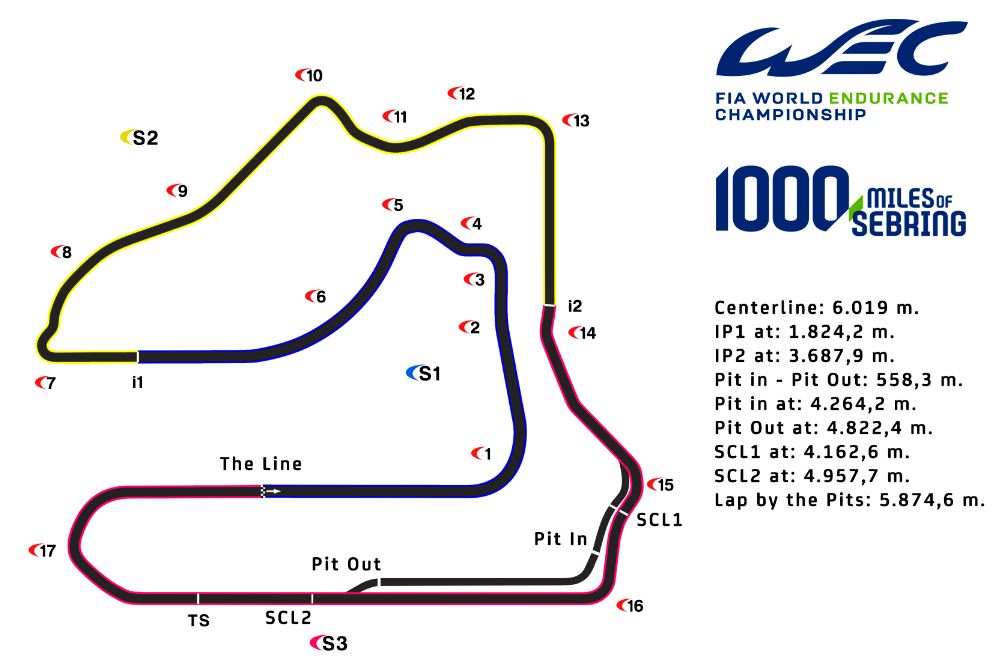
Sector 1 is opened by turn 1, the fastest corner of the track, but is also dominated by Turn 3 and 5, with the latter being pretty important for lap times, because it leads to a fast section of the circuit.
The corners having a stronger influence on lap times are anyway slow-to-medium speed ones, in particular T7 in sector 2 and T17 in sector 3, with the latter being probably the most important in terms of final performance.
The first sector is the only one including a proper fast bend, still each sector has a combination of very different corners in terms of minimum speed, making downforce still a dominant factor for performance.
Because of Sebring very specific charachteristics, it is reasonable to think that teams who collected more experience in this circuit, either because they raced here in previous seasons (see Toyota) or because they tested before the race, could have a substantial advantage. With this respect, even if seeing a manufacturer struggling so much was surely strange, one could imagine that Peugeot was at disadvantage compared to Toyota, but also against Ferrari (who tested in Sebring before the race) and teams racing LMDh cars, like Cadillac that also race in the IMSA Weather Tech Championship and had done so with their previous DPi machine from 2017 to 2022.
BoP
Very important in terms of performance was of course also the BoP used for this first race of the season. The renewed system will not apply BoP changes on a race basis, but those will stay constant for a longer time. After Sebring (where specific values were applied), the BoP should not get changed for the following three races, that also include Le Mans.
In Sebring, the maximum power and minimum weight for each car were as follows:
Toyota: 1062 kg, 517 kW
Ferrari: 1057 kg, 515 kW
Peugeot: 1049 kg, 518 kW
Porsche: 1048 kg, 517 kW
Cadillac: 1038 kg, 513 kW
Glickenhaus: 1030 kg, 520kW
Vanwall: 1030 kg, 511 kW
It was of course not nice to see how LMH class privateers (Glickenhaus and Vanwall) struggled in Sebring.
While Vanwall was new to the class, the American team actually raced here already and with decent pace too. In all honesty, I think few had expected the privateers to have the same pace as the big manufacturers: Vanwall seemed to struggle with reliability and this is probably normal with a new car. But it would be interesting to see how Glickenhaus will perform in the next events in Europe, before Le Mans, as they did not surprise in a positive way in Sebring; many were expecting Glickehnaus to perform better (they had the best BoP of the class, staying at the minimum weight and maximum power allowed by the regulations) and have better reliability.
Performance Analysis
Now to the interesting numbers.
As already mentioned, Toyota dominated the race, with an amazing pace and a perfect execution. Their two cars had similar pace and probably also managed fuel consumption very intelligently: both crews could be heard lifting and coasting before braking points already during the first laps of the race and, realistically, until the end. The winning car could even avoid a final pit stop by saving fuel in previous phases. This is reflected by the data. Let’s take a look.

Beside confirming that Toyota had a sensible advantage on the rest of the field in terms of pace, the above tables underline how the closer crew in terms of pace was Ferrari n.50, while the other italian car struggled more and felt also behind the Cadillac n.2.
Both Porsche cars were significantly slower than the Cadillac, despite belonging to the same set of tech rules. They apparently struggled with rear tyre degradations, already in the first hours of the race.
Peugeot was very far not only from the best, but also from the next fastest team. The French team was reported having severe issues in controlling their ride heights, partly also because they were probably not prepared enough to tackle the challenges of this special circuit.
The two Toyota were pretty close to each other. Anyway, it is interesting to notice how actually the winning car was slightly slower than Toyota n.8. The latter did a pit stop more than the sister car, when the Hartley drove into the pit twice in two laps, once under full course yellow and the second time immediately after the restart. The rules in fact did not allow to full refuel the car under full course yellow, as far as I got but the car needed some fuel to at least go on before properly refueling. Result was car n.8 spent about 41 seconds more into the pitlane than car n.7.
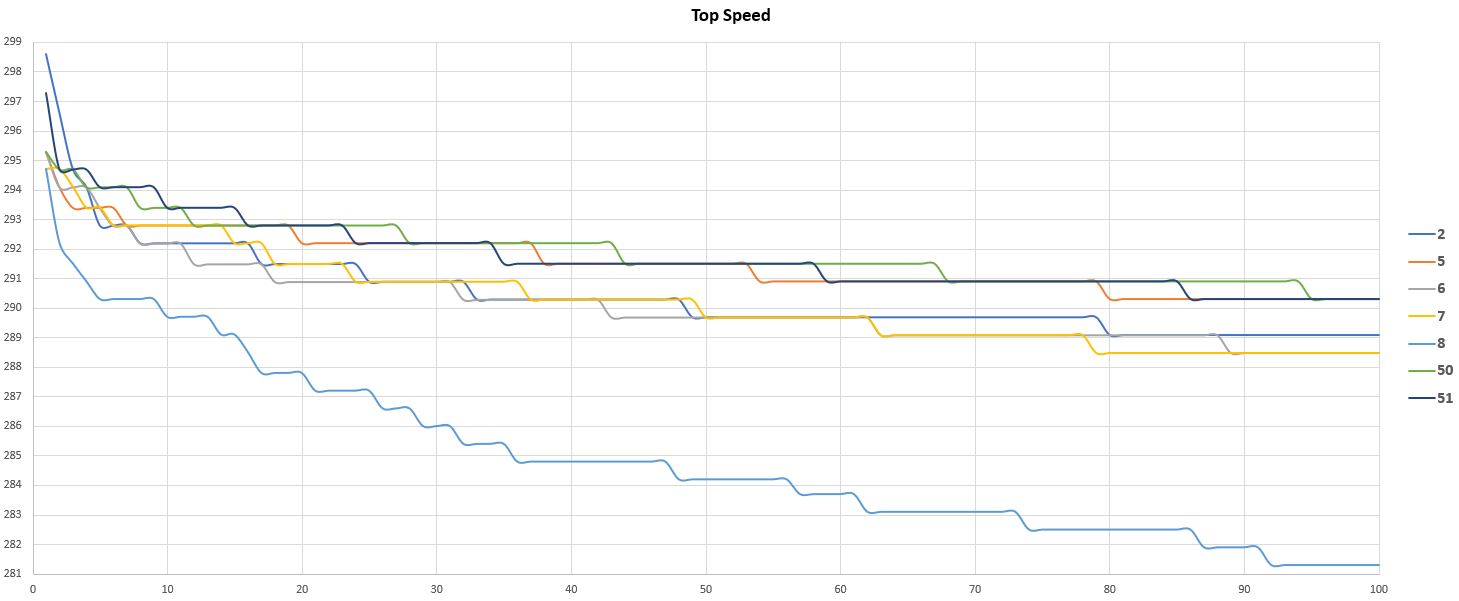
Car n.8 was also constantly and sensibly slower in terms of top speed than the sister car. While this could be down to a different aerodynamic setup, the difference could also be due to a more aggressive lift and coasting, at least when passing over the speed trap before T17 and this seems the most realistic scenario to me.
One final point to notice is how the Ferrari n.50 was actually closer to the two Toyota in sector 3, than in sector 1 and 2, thanks maybe also to an higher top speed. This could be related to a less aggressive fuel saving too.
All of this is graphically reflected in the picture below, depicting the best 100 laps of each crew. Lap time is on the vertical axis, while the horizontal one counts the laps.
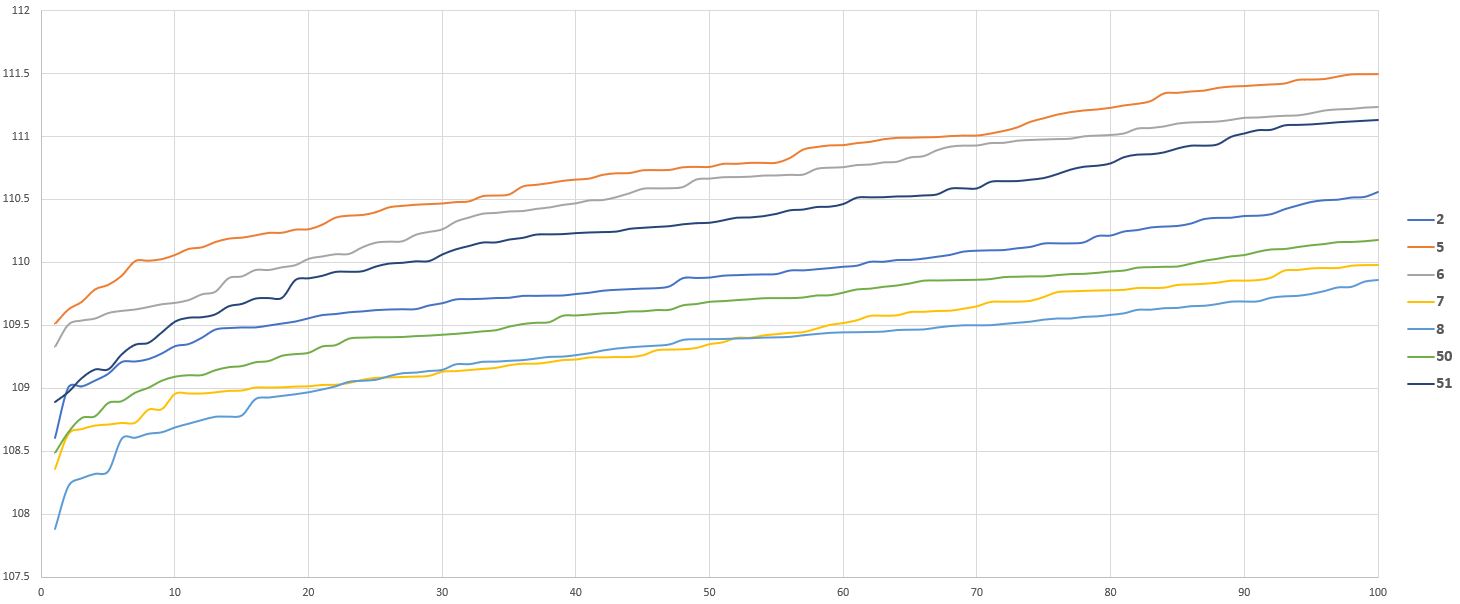
The above plots do not consider the two Peugeot and the privateers, as they were sensibly slower than the rest of the pack anyway.
The lines relative to the two Toyota intersect two times, confirming how close the two cars were to each other. By looking a bit at the onboards and at the pit stops sequence, it looks like both cars were saving fuel but it could be realistic to think that car n.7 did this more aggressively towards the end of the race.
Ferrari n.50 was clearly the best of the rest. The sister car struggled much more instead and was sensibly slower than the Cadillac. One of the reasons for this difference, seems to be that car n.51 drivers are averagely a bit heavier than those wheeling car n.50.
Anyway, we will see in a minute how there are also other clear reasons for this difference.
What about each sector performance?
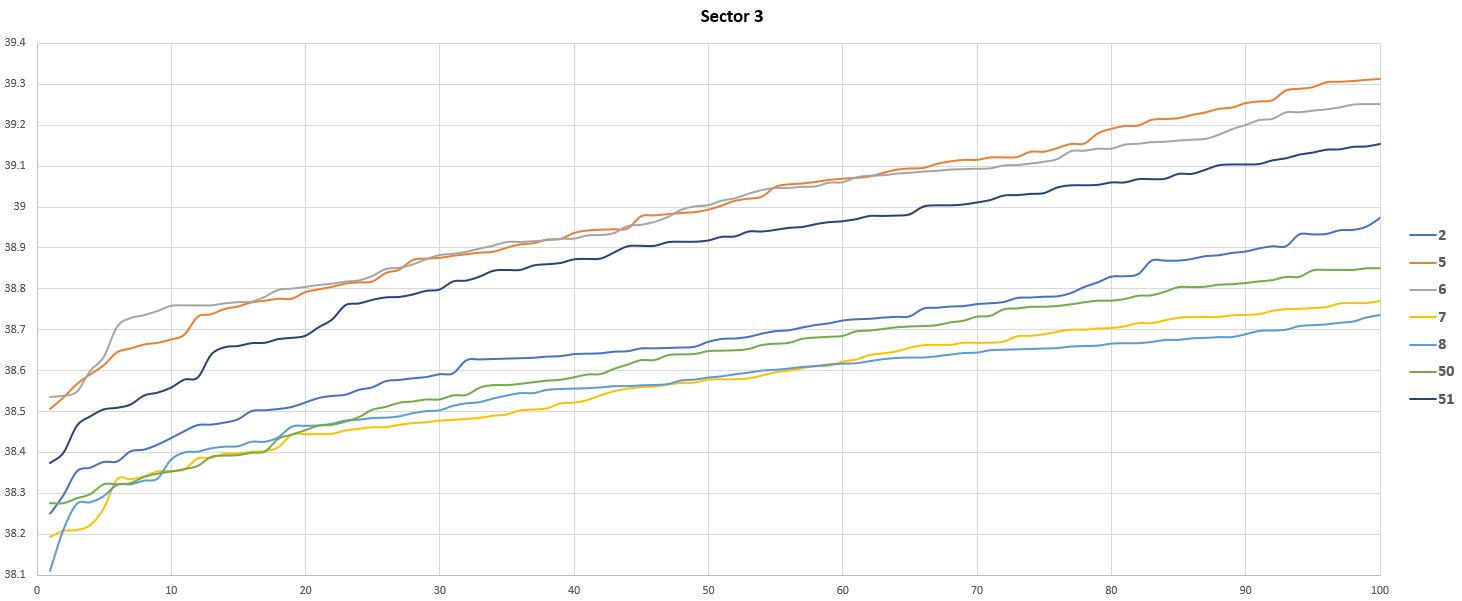
Beside the above table, how each car performed in each sector is shown clearly by the pictures below.
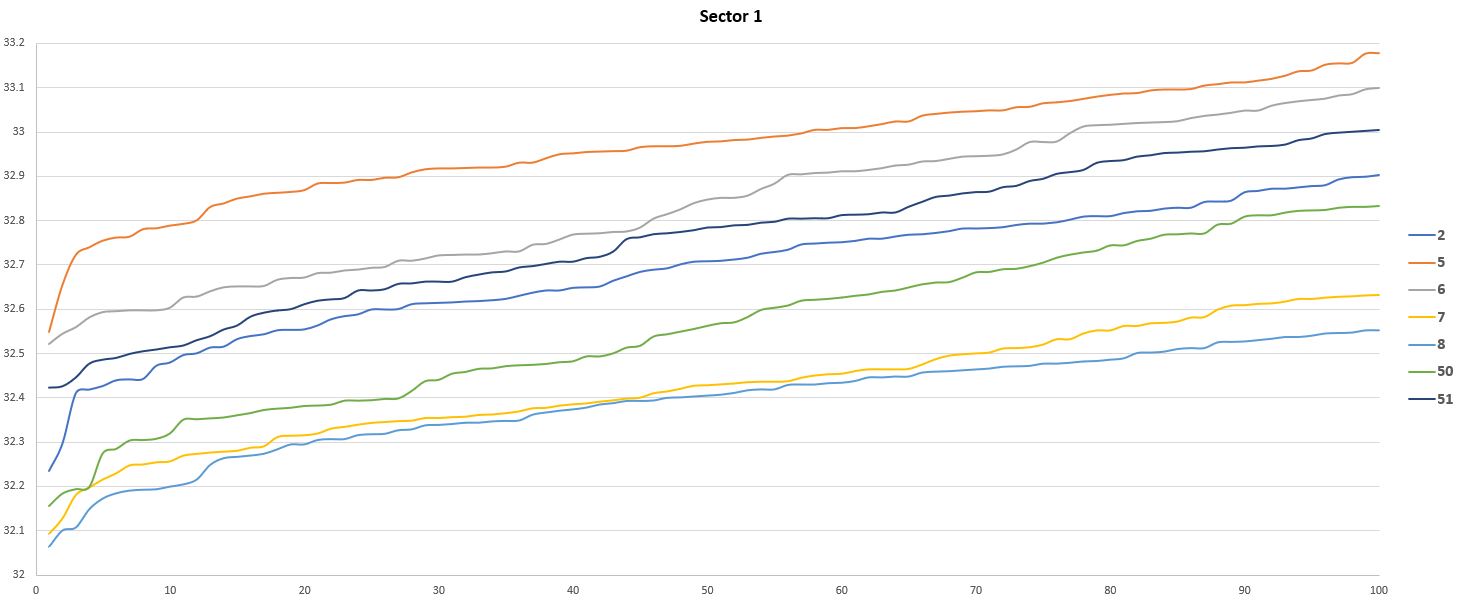
Toyota n.8 had a small, but consistent edge on the sister car in both sector 1 and 2. Considering everything, we are really talking about small differences here and it is really astonishing to see how close the two crews were to each other, in terms of performance. Still, a small advantage over an 8 hours race can make a difference and one could wonder what could happen without that double refueling for car n.8.
All the other cars, with the Ferrari n.50 on top, were left behind in each sector, but they surely struggled the most in sector 1 compared to the Japanese squad.
While Ferrari n.50 seemed to stay close to the Toyota if we look the best 20-30 sector 1 times, they fell behind on the long run (we will dig deeper into this later).
The Cadillac, the second “best of the rest” car, was, in relative terms, not particularly close to Ferrari n.50 in this section of the track, but surely better than all the others, Ferrari n.51 included.
As for Porsche, it is interesting to see how car n.6 was consistently faster than car n.5 in sector 1 and sector 2, with the difference in the first sector being pretty big. Aynway, the two cars were pretty close to each other in sector 3. A possible reason for this will become clear in a minute.
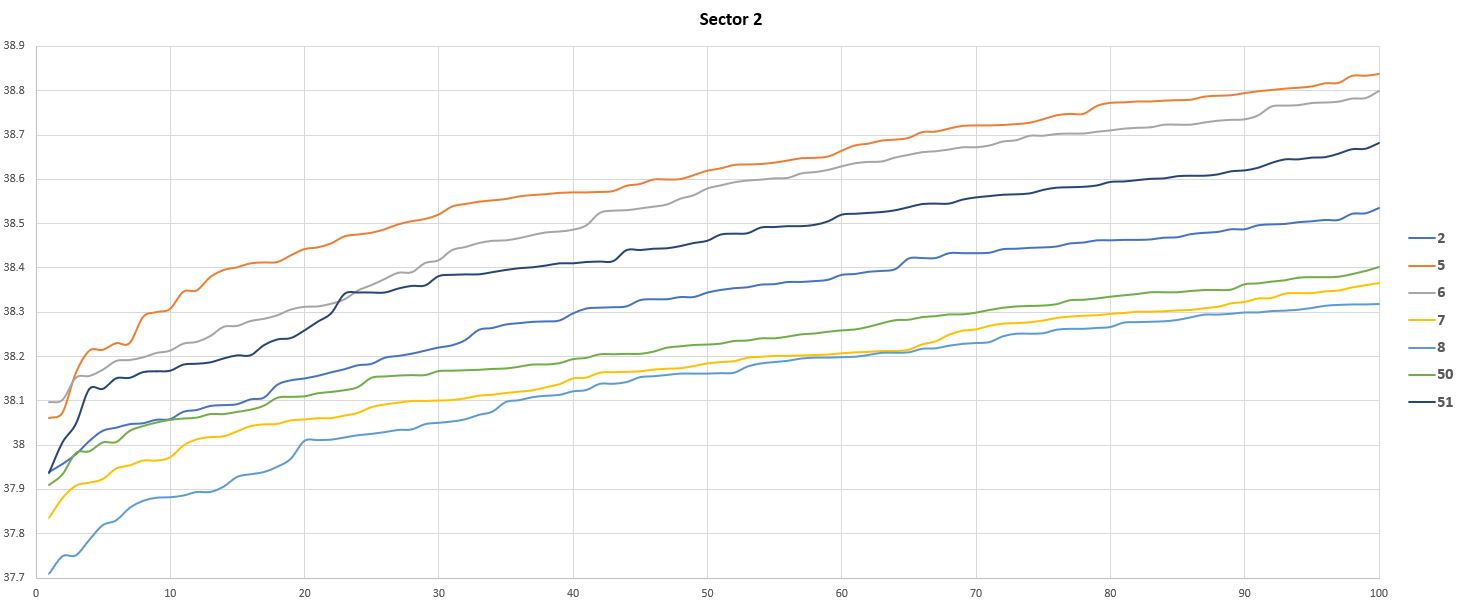
Sector 2 was a bit more favourable to car n.50, who kept a gap of about 0.1 seconds pretty consistently from the Toyota, above all considering more laps.
The Caddy was a bit slower than Ferrari n.50, but still better than car n.51, with Porsche being the slowest of the manufacturers again.
Both Ferrari n.50 and Cadillac were surely closer to Toyota (and to each other) in sector 3. Car n.50 in particular seemed to be able to keep both Toyota honest if we look to the first 20-30 best sector times, but felt behind when considering more laps. This is a point you should remember, as we will come back to this shortly.
Also the Cadillac stayed close to the top in sector 3. This could confirm that the two Toyota were managing fuel, as their top speed was also on the lower side of the pack, particularly considering car n.8 (see picture below).
Another interesting point, also related to top speed and fuel saving, is how in sector 3 the Toyota n.8 did not have the advantage they had on the sister car in the other sectors. This, together with the lower top speed, could maybe suggest how the crews were both saving fuel, but in different ways, with car n.8 maybe doing this more aggressively before the braking into turn 17, while car n.7 maybe was “distributing the effort” more evenly during the full lap. Of course, I have no specific data at my disposal to prove this wrong or true.
Interesting also to compare again the two Porsche. Car n.6 has a slightly lower top speed than car n.5. We have seen how sector 3 was the only one where the two cars had a similar performance, while over the rest of the track car n.6 was consistently faster. This difference in top speed could surely be one of the reasons, as a big portion of sector 3 is indeed the straight leading to turn 17, where also the speed trap is located.
Was the advantage of the Toyota related only to their superior car?
Well, maybe not only.
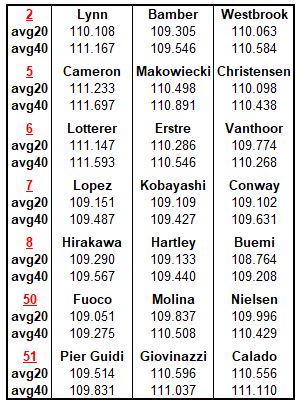
The table below provides the best average 20 and 40 laps driven by each driver of each crew during the race.
Before digging into any analysis, let me use a word of caution when looking at the above table. First of all, even assuming that each driver of each car left the pit at the beginning of each stint with the same amount of fuel as his team mates, I have no clue about the status of the tyres.
The tyres, in particular, seem to be an even more important topic than the were already. The new design brought by Michelin, which uses a more green approach and promise to be easier to recycle, and the ban of any kind of tyres warming device or procedure produced some troubles for the teams. Tyres are always very sensitive to track and ambient temperature, but it seems this was a bigger issue than ever in Sebring, as many struggled during the first laps with low grip and cold rubber.
Considering the race was about 8 hours long, it is no surprise that track and ambient conditions changed sensibly during the competition. Air temperature, for example, went from about 25 deg C at the beginning of the race, to about 29 more or less mid way, to less than 25 at the end. In the same time range, track temperature also changed from 32.5 deg C, to 42, to about 31 in the closing phases.
Beside this, I do not know if any car got any damage during the race, making it slower when a new driver jumped it.
After this premise, let’s look at the numbers, once again.
The first thing we can notice is that Toyota’s drivers were extremely well balanced in terms of lap times, with maybe the only exception of Buemi being slightly faster than the rest. All had very similar pace to each other and this could also be a testament to the car being easy for all of them to be driven fast in a consisten manner, and to the team doing a good job in managing the race.
This parity between all the drivers was absolutely not the case for the other teams.
If we look at Ferrari n.50, we see how Fuoco was much faster than his team mates, with an advantage between about 0.8 seconds and 1.2 seconds for the 20 and 40 best lap times average. This is a very big span!
The situtation was not much better for Ferrari n.51. Here, Pier Guidi was between 1 seconds and 1.3 seconds faster than his co-drivers (and this beside the n.51 car being constantly slower than car n.50, as we saw).
Also for Porsche, there was a pretty big difference between the fastest drivers of each car (Christensen and Vanthoor) and their team mates, with gaps spanning between 0.5 and 1.2 seconds.
The situation was only slighly better for Cadillac, with Bamber being clearly the fastest guy at the wheel.
I really need to stress this once again: these data need to be taken carefully, as we don’t know the conditions of track, car, tyres, traffic, etc. that each driver met during his stints. But I think they still show an important factor differentiating Toyota’s status to those of all the other teams, at least for now.
Without knowing how all of these factors played a role on each driver performance, we could wonder if the differences we see are down to pure driving, to the car suiting the driving style of certain drivers better or if some of the cars were simply harder to drive consistently.
Considering this latest comparison, what would the situation look like if we compared each crew to the others by only considering the best driver of each car? This is shown in the following table.
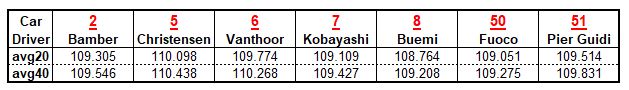
If we would assess teams performance only by looking at the table above, we would get a completely different picture.
First of all, Ferrari n.50 car would split the two Toyota, being slightly slower than car n.8, but also a bit faster than the winning car n.7.
Of course, one could ask what each car fuel strategy was. As discussed, it looked like Toyota was saving fuel during the race.
Still, we could say the Ferrari had pace, basing on this information only.
The other interesting bit is again the pretty good performance produced by the Cadillac, which was actually pretty close to both Toyota and Ferrari, above all if we look at the average of the best 40 lap times.
Of course, Sebring was only the first race and everything is new for every team considered in this analysis except Toyota. So it would be no surprise to see some serious progress for some of the competitors. This, or any BoP change, could surely provide some further excitment (or anger) for the fans!
The BoP will change slightly for the next races, until Le Mans, but hopefully coming to more traditional tracks, lile Portimao (that has been resurfaced in the last years and is not as bumpy as it was before) and Spa could produce some exciting show and closer racing.


Leave a comment