Hi everybody,
this is the third and last entry about DTM 2020 Class One cars and will build on the previous two, focusing on a performance analysis based on lap time simulation. I will look into the sensitivity of a few key metrics to certain setup and design parameters and on how the team could optimize the usage on tracks of aids like the DRS.
Lap time simulation tool, track and vehicle model
For this study I used my lap time simulation tool. Anyway, I did this analysis some time ago, and the tool did not incorporate yet all the features it has now. I will post an entry on the latest additions I built into my lap time simulator: examples of features that the tool did not have yet at the time I performed this study were suspension compliance (camber stiffness), separation between sprung and unsprung masses, an improved rolling radius calculation and some new enhancements in track modeling.
This study will focus on the Hockenheim circuit, in its GP configuration. Hockenheim is a 4.574 kilometer long, German track that historically belongs to DTM calendar and also offers an extremely interesting combination of slow, medium and high speed corners, together with a long, full throttle section, where pretty high top speeds can be achieved and where most of the overtaking maneuvers take place.
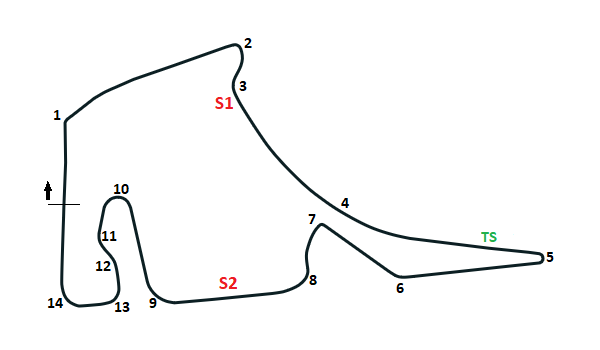
The circuit is usually divided into three sectors, as described in figure 1, that also shows the numbering for the corners this article will refer to.
The vehicle model was built basing on the data discussed in the two previous entries and referring to a hypothetical qualifying trim. A summary of its main features is:
- Vehicle mass of 1090 kg (1070 kg for car and driver, 20kg fuel)
- Wheelbase 2750 mm
- Front track width 1640 millimeter
- Rear track width 1610 millimeter
- Mass distribution of 50% on the front axle
- Brake balance 62% on the front axle
- Aeromap and average values of downforce and drag as described last month, aerodynamic balance of about 45.8% (averages on the map)
- Maximum engine power of about 615hp
- Gear ratios provided by the regulations, drop gears selected among allowed options
- DRS effect: drag drops about 18%, downforce by about 20%, aerodynamic balance moves significantly forward
- Suspension kinematics based on manufacturers data
- Suspensions stiffness and static camber as described in previous instalment
First simulation run
The first simulation runs were performed without activating the DRS. I did not model the P2P, for the sake of simplicity. Moreover, its effect should be smaller than DRS one, because of the limited time it can be used.
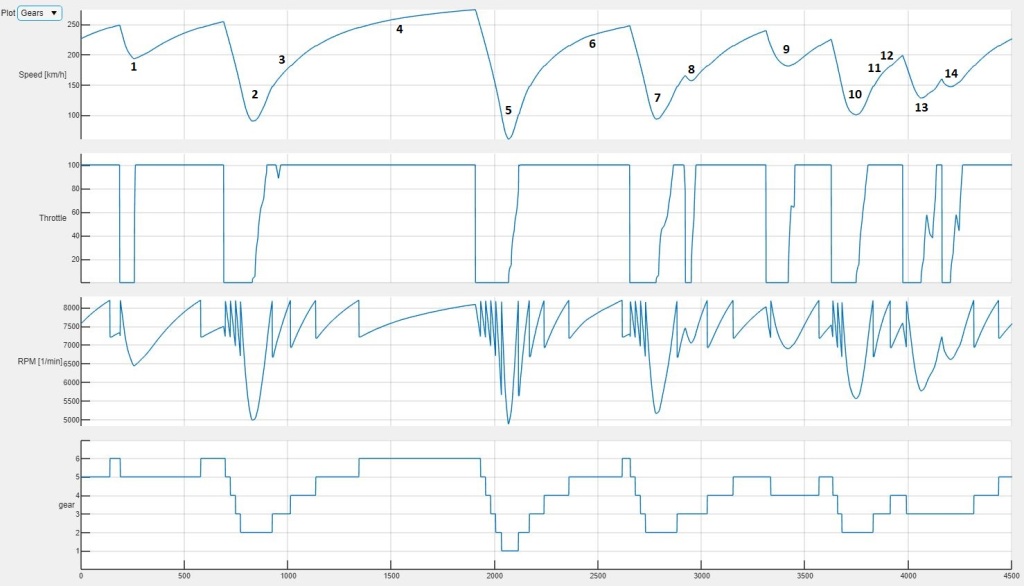
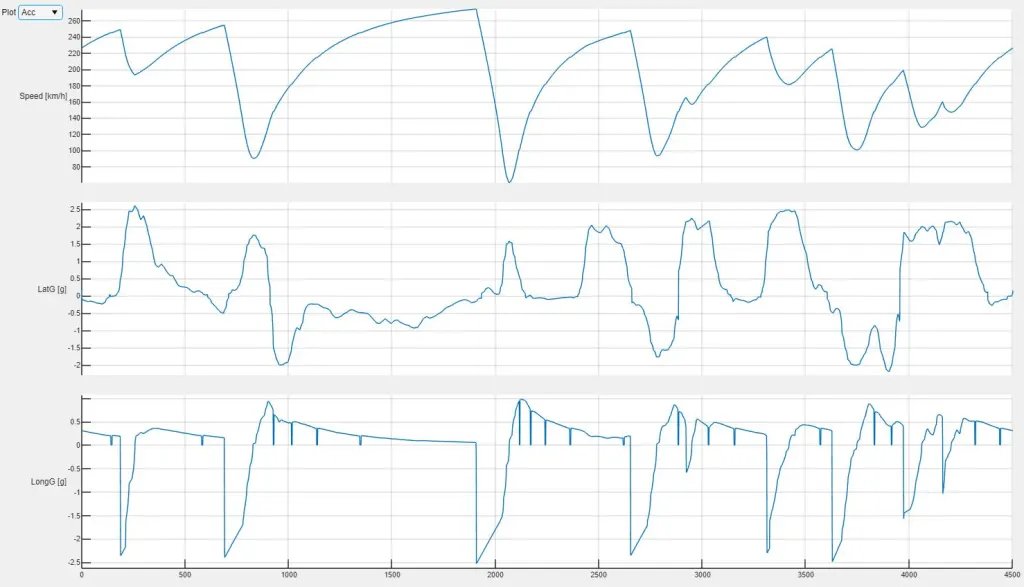
The first run produced a lap time of 1’28.885, with a top speed of 274.4 kph. The model achieves a maximum lateral acceleration of 2.6g in turn 1, with a minimum speed of about 193 kph. Turn 5 is the slowest corner and the only one where first gear is engaged; the minimum speed here is about 60 kph. Turn 2, turn 7 and turn 10 are also relatively slow corners, driven in second gear and with minimum speeds between 90 and 100 kph. Turn 9 is another fast bend: here our vehicle model pulls about 2.5g, with a minimum speed of about 181 kph.
Slightly less than 70% of the lap is covered with the throttle completely open.
Figure 2 depicts, from above, the traces relative to vehicle’s speed, throttle position, RPM and engaged gears, while figure 3 shows again speed, lateral acceleration and longitudinal acceleration. Corners numbers are also shown in figure 2.
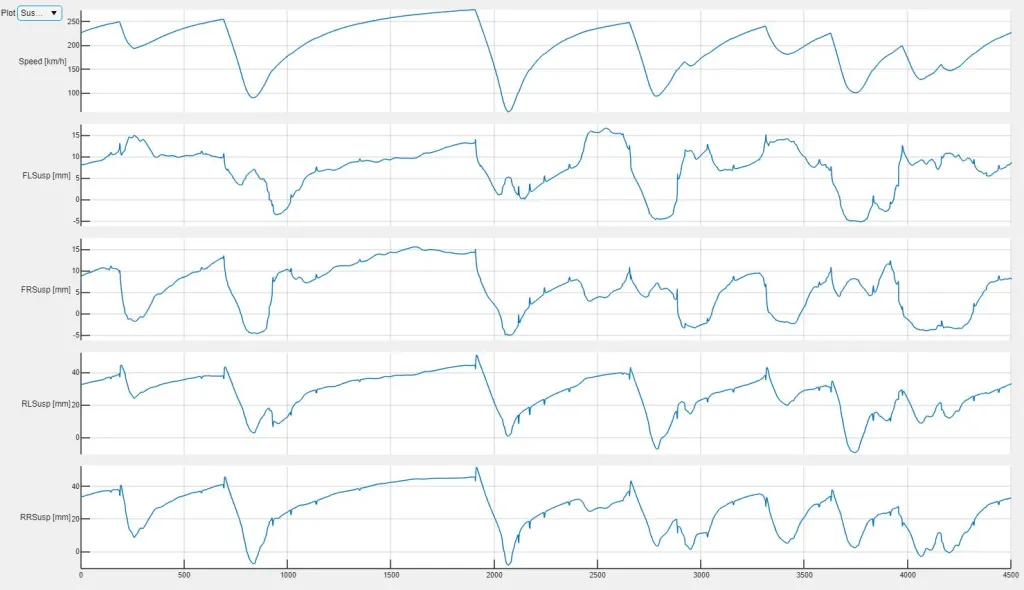
Suspensions’ behavior is particularly interesting. Wheel travels are shown in figure 4, where the first trace from above is car’s speed and the following ones are respectively front left, front right, rear left and rear right wheel travels. Positive values for those indicate the suspension moving into jounce (compressing the springs).
Front wheel travels are, as expected, much smaller than the rear ones, as front wheel rates in heave are much higher. Front dynamic ride heights have a critical influence on both downforce and aerodynamic balance.
The front axle achieves the highest wheel travels in roll, not in heave or pitch (for example during a braking maneuver). Also, front springs initial compression during braking is minimal, despite the suspension not engaging any bump stop and the pretty high longitudinal acceleration. The low vertical wheel travel in braking is linked to the aggressive use of anti-dive effects at the front while the big wheel travels in roll are due to the relatively low front roll stiffness and the low geometrical anti roll effects (or, in other term, low roll center height), as described in part 2.
The situation is different at the rear, anyway. A first key element, is how the rear springs are compressed at the beginning of a braking phase, despite the longitudinal load transfer that tends to decrease the vertical load on the rear axle. Also very interesting, this counterintuitive phenomenon only happens at the very beginning of the braking zone; this is again a consequence of the high anti-effects designed into the suspension: because of the high longitudinal forces in the first part of a braking, a high moment that tend to extend the springs is generated.
Rear wheel travels in roll are, on the contrary with respect to the front, smaller than the travels that the rear axle experiences in heave. Indeed, the rear axle has a higher roll stiffness and the geometrical anti roll effects are also sensibly bigger than front ones (higher roll center).
Linked to suspension travel, is how the aerodynamics performance of the car evolves during a lap, because of ride heights influence on downforce, drag and aerodynamic balance. The aggressive use of anti-effects described above has the main goal of controlling the aerodynamic platform, to maximize downforce and minimize center-of-pressure shifts.
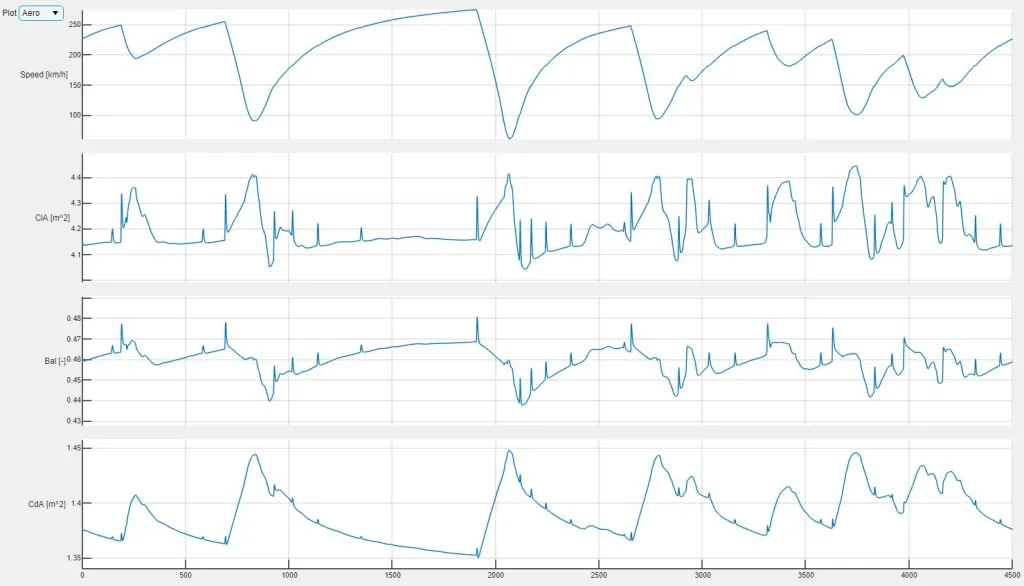
Figure 5 helps to understand the effectiveness of the above strategy of using jacking forces to compensate third springs’ absence. Again, the first trace from above is car’s speed, followed by the downforce coefficient (ClA), the aerodynamic balance and the drag coefficient (CdA).
The aerodynamic balance trace has a spike only at the very beginning of braking phases, but this is relatively limited in magnitude. Despite the strong anti-dive limiting suspension travel, under longitudinal weight transfer the front wheels also deflects, producing a drop of front ride height and changing aerodynamic properties.
Immediately after, thanks also to the rear suspension going into jounce at the start of braking phases, the aerodynamic balance moves toward the rear and this should improve corner entry stability. This is particularly crucial in high speed corners like Turn 1 or Turn 9.
Another interesting element, also linked to suspensions heave stiffness, is how the drag drops at higher speed, something very beneficial for top speed. This is mainly due to pretty high rear wheel travels, consequence of relatively low rear wheel rates.
A similar high speed drop can be spotted on downforce too. Anyway, with respect to this metric, what is really interesting is how the downforce coefficient goes up again at the entry and at the apex of each corner, mainly due to the raise of rear ride height; once again, this is particularly important in high speed bends like Turn 1 and Turn 9.
As discussed in my previous entry about Class One DTM cars, teams used pretty high static camber angles, as this seemed very effective in terms of performance and tyre exploitation.
Keeping in mind that the simulations described here do not consider any compliance, which would further push the outer wheels toward positive camber and the inner wheels toward negative camber (affecting grip negatively on both sides), it is interesting to analyze how each corner camber angle changes during a lap, under the effects of heave, roll and steering angle at the front. This is shown in figure 6.
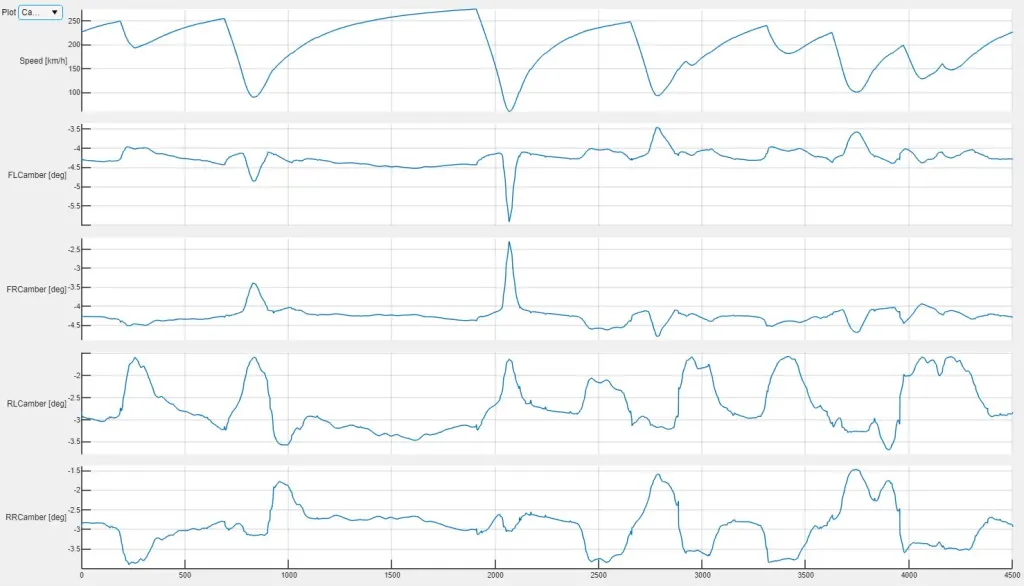
Focusing on the front axle first, we can recognize how, in slow corners, front suspension geometry, in particular with regards to caster angle, produces a significant camber change as a function of steering angle: for example in Turn 5, the front outer wheel moves toward more negative camber angles, presumably improving front axle grip and reducing understeer (typically an issue in tight corners). This happens mainly at the apex, where the steering angle reaches its peak. In corner entry, where the cars starts to roll but the front wheels are not yet steered much, the outer wheel experience initial positive camber change, instead.
On the other hand, in fast corners like turn 1, front outer camber goes toward positive values, compared to the previous straights, because roll stronger effect compared to the low steering angle required in higher radius bends.
On the rear axle, instead, in each corner roll pushes the outer wheel camber angle toward more positive values and, most probably, in a window where lateral grip drops, thus making camber gain with wheel travel even more important.
Sensitivities
How sensible is the model to a change of some of its main features?
The results obtained varying some key parameters are summarized in the table in figure 7 . Here, each sector time (identified as S1, S2 and S3), the final lap time (LT), top speed (TS) and the differences (both in absolute and relative terms) to the baseline are provided.
All these runs have been performed without activating the DRS.
Keeping in mind the uncertainty relative to the tyre model, it is clear how grip is surely the stronger performance driver; this is actually no surprise, above all in a track where the car negotiates most of the corners in grip limited conditions.
Mass is the second strongest performance driver. In a class with a mandated minimum weight, one could think mass would not be an important parameter. Anyway, a too conservative approach with respect to the fuel load would change the overall weight, for example. The above results show how each single kilogram of fuel would produce a sensible drop in performance and how important crews precise fuel consumption calculations were.
Engine power has, on this track, a stronger effect on performance than downforce. It is also no surprise, that increasing engine power leads to an improvement mainly in sector 2, where the longest full throttle section of the car is located.
In terms of aerodynamic, having more downforce seems more effective than trying to reduce drag.
The CG height has a very small effect on lap times, instead.
Tyre management
As discussed already, an extremely important topic for last generation DTM Class One cars was tyre degradation.
The simulations we are analyzing refers to qualifying conditions, while tyre degradation is a topic mainly related to races. Still, it is possible to analyze how certain parameters influence not only final performance, but also the stress that the tyres experience on track.
To do this, we will look at tyres friction energies. They do not tell the complete story about tyres stress, but are relatively easy to calculate, give a decent picture about what happens to tyres outer layers and are a reasonable way to quantify how a certain set of parameters changes the way tyres are exploited with respect to a given reference.
As mentioned, teams used a relatively front biased weight distribution and tried to avoid moving mass towards the rear of the car to try and relieve the rear tyres a bit. It this also effective in terms of lap times.
The table in figure 8 considers the baseline run and two further ones, where the static weight distribution was moved respectively 1% toward the front and toward the rear.
It contains again sector times, final lap time, top speed, lap time variation in each run and each tyre friction energy delta, compared to the baseline.

A more rear biased mass distribution produces better lap times in simulation environment with the considered tyre model. We could acually ask ourselves if the same would be true on a real track with a real driver: simulation models are most of the times front grip limited in cornering conditions (understeer), hence any setup solution helping to exploit the rear tyres to a bigger extent would help improving cornering speeds. This normally also produces a more oversteery car though. Would our DTM drivers like this? A higher rear axle saturation generally means a lower stability. This could be effective in qualifying, for a flying lap, but could be detrimental for driver’s confidence during the race, where tryre degradation would further move vehicles balance toward oversteer.
What is clear is that lap times improvements linked to a more rear biased mass distribution are achieved anyway at a price of a bigger friction energy (and, hence, degradation) for the rear tyres.
Shifting mass distribution 1% toward the front produces a bigger lap time delta than doing the same toward the rear while rear tyres energies are always more affected than front tyres ones from any shift in mass distribution.
Moving mass toward the rear normally also improves traction out of slow corners, beside the effects described above. This means both bigger rear lateral forces and longitudinal forces: both factors increase the stress experienced by the rear tyres.
DRS optimization
We will now focus on an example of how teams could optimize DRS deployment, to get the maximum lap time gain.
I could identify five zones, where the DRS can be activated complying to the rules:
- Turn 1 – Turn 2
- Turn 4 – Turn 5
- Turn 5 – Turn 6
- Turn 8 – Turn 9
- Turn 14 – Turn 1
Another possible application zone would have been between turn 6 and turn 7, but that section is very short and I neglected it.
The lap time gain obtained activating the DRS in each zone depends not only on the assumptions considered in terms of drag, but also on the effective distance over which the DRS remains open. The simulation runs produced the results summarized in figure 9 table.

As we could expect, the biggest gain is produced between turn 4 and turn 5. This is not only the longest activation zone, but also the section of the track where the highest speed is achieved.
The best three zones identified in the table in figure 9 are indeed the longest sections of the circuit where DRS can be deployed.
Ideally, one would want to activate the DRS from the exit of turn 5 to turn 7, but even if, in normal circumstances, in turn 6 the car does not operates in grip limited conditions, the lateral acceleration overcomes the threshold mandated by the rules for DRS activation. Moreover, the rear downforce reduction and consequent forward aerodynamic balance shift would make the car pretty unstable.
The total lap time drop thanks to DRS is 0.436 seconds and the final simulated lap time is 1’28.450, that is reasonably close to 2020 pole position (1’28.405 for race 1 and 1’28.337 for race 2), taking also into account that these simulations did not consider the P2P.
Also in 2019, when the rules did not allow any DRS deployment in qualifying, the pole position time was a 1’28.972, that is not far from the 1’28.886 this vehicle model produced without DRS.
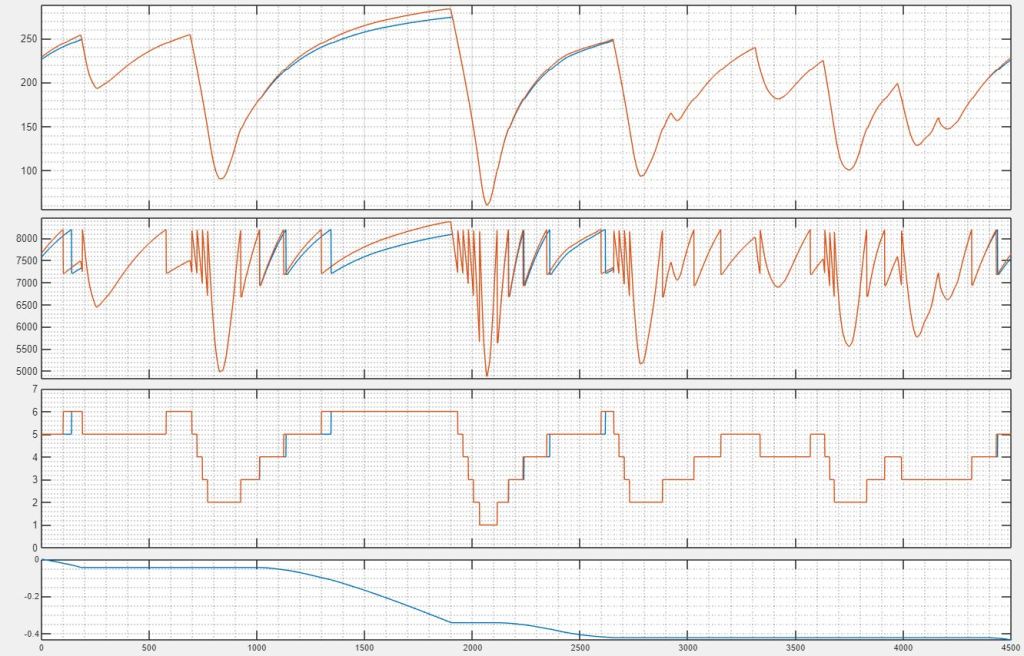
Figure 10 offers a comparison between the baseline run (in blue) and one with the DRS open in the three best zones (in orange).
Shown traces from above to bottom are vehicle speed, RPM, engaged gear and the compare time between the two runs.
This closes the series of three articles where i tried to present a deeper dive into the latest iteration of Class One DTM; the aim was to better understand both the regulations and how the teams explored them to extract the amazing performance these cars produced on track, despite all the imposed limitations. For me, this was another extremely interesting application of lap time simulation, even with a simple tool like mine; this still allowed to analyze into details the effects of both design and setup parameters both from a performance and handling perspective, helping understsand not only how fast these vehicles were but also why.


Leave a comment