Happy new year everyone! Let’s start this 2014 well posting immediately something new here!
As you may have seen, driving simulation has become one of my main interests, in recent times. It allows to explore interesting possibilities regarding vehicle dynamics simulations, analyzing also driver influence and its perception of vehicle balance and stability.
Anyway, there is still a point we didn’t explore into details in none of the posts I published till now: how close the performance and the behavior of a vehicle model built in rFactor (or, in general, in a commercial driving simulation software) can be to its real counterpart?
Let’s analyze how a Formula 3 vehicle model driven on the “virtual” Monza circuit given with rFactor package performs compared to the real car, a Formula 3 in 2008 FIA configuration driven by a real driver on the same circuit during a free practice session of the British Formula 3 Championship race held in May 2008 in Monza.
One of the reasons why I have chosen exactly this event to make this comparison, is that the car was used on track set in a way that was overall pretty close to the “Manufacturer delivery configuration”. For example, this was one of the few times where the team didn’t use bump stops: they can be designed into rFactor pretty flexibly but their real behavior is very much affected by usage and wear. Their absence has made the modeling and the data comparison much easier, allowing to concentrate on more sensible and easy-to-measure parameters.
The scope of this article isn’t to have a perfect matching between real car and simulated car output, no matter what it needs to reach this goal, although it could be pretty easy to do by “tricking” somehow the model until output data is matching perfectly to real car data logging. What I want to analyze here is how close the results we could obtain in a cheap driving simulation software could be to the real thing if we input data that we believe being trustable and accurate when building the model itself.
The model has been built into rFactor using all the knowledge I have grown regarding vehicle modeling in this environment and basing on data coming from direct car measuring (suspension kinematics, components weight, setup, brake system, etc) and from manufacturers data (engine torque curve, aerodynamic data, tire data, inertias, etc).
The “virtual” vehicle has then been set up with the same setup parameters used during the real test. The only two aspects which were not set to be exactly the same were downforce and drag: the value used in the model are reasonably close to the real ones and come from manufacturer data; anyway, some of the small aero ancillaries that were in Dallara F308 (located mainly in the underside and near the tires) were taken out to further reduce drag and to help to increase top speed. Unfortunately there is no available and trustable data about these changes.
It could be possible to empirically reproduce into the vehicle model both the real level of downforce and drag produced by the real car via “trial and error”, but I preferred to stick to the manufacturer data to also have a more reliable and repeatable set of information, a more trustable final model and to proceed in a more “scientific” way, using measured data instead of doing an estimation that could end up being not only wrong but also difficult to control.
Of course, also the manufacturer data could be somehow wrong, as far as I know. Anyway, I trust them more then how much I trust an aero measurement I could do on track without proper hardware.
As we will see, this had only a very small influence on vehicle performance.
During the race weekend I took this data the team had two cars on track. The data used as a reference here are coming from the fastest of the two cars: the driver at its wheel performed among the fastest pilots during the free practice sessions. Anyway, some small considerations must be done when looking to the performance:
- Although being overall faster, the driver using this car has always shown on data lower decelerations values in brakings and lower brake master cylinders pressures compare to his team mate.
- The car was run with nearly new tires, because the team only entered that appointment of the F3 British Championships and had no used tires to use for free practice.
The simulated vehicle model, on the other hand, has been driven by a real driver who uses driving simulation quite often and who has also driven F3 cars before. Unfortunately, I didn’t have the possibility to let the same driver to drive both real and virtual car. Life sometimes is hard!
Anyway, we will see that also this point is not compromising the general meaning of this investigation.
Last, the track model which was already included in the software, is something over which I had no control. Although it seems visually very close to the real track, I could not verify its accuracy. Looking to the data output, it seems reasonable to believe that some zones of the “virtual” track are slightly different than the real counterpart.
Unfortunately, since this study is mainly a private initiative (mine!), the use of a more detailed track model, for example built basing on more advanced and accurate technologies like laser scanning, was, of course, out of scope. Let’s wait (and pray) for some new products coming on the market soon, which should have some very accurate track models included.
The first metric that we will analyze is the speed (data acquisition) trace of both the simulated and the real car.

A general look shows the two traces are pretty similar. The straight performances of the real and the simulated car are very close, with small differences coming mainly from the mentioned discrepancy in the aero configuration and from a slip stream that the real driver managed to take before the “Ascari” corner (third long straight in the picture above). It can be seen that the real car tends to have a slightly higher top speed, probably coming from the slightly different drag.
Corners speed are pretty close; in general there are only small differences connected to the driving style and, in Lesmo corners, probably also to a different track layout, as we will see later.
Also track lengths shown in the simulated and in the real data acquisition files were slightly different (5840 m ca. for the real car data vs. 5785 ca. for the simulated ones). Regarding this point, we should keep in mind that the real car speed trace comes from a wheel speed sensor signal, which measures the angular velocity of a wheel (front right wheel in our case) and then the actual car speed is calculated using a fixed wheel circumference. The reality is that the wheel circumference changes during motion (because of loads and centrifugal forces) and that we cannot trace exactly the path of the wheel during a lap. On the other hand, the simulated data refers to a “vehicle” speed measurement (in virtual environment, we don’t have the problems we have with a real car and all the measurement are “real”, with no errors coming from sensors accuracy and from measurement process: of course, the trick is that this data is not really measured, but only calculated by the software).
In general, it is pretty difficult to properly align the two files and, as a consequence, to be sure that the two cars were passing on the same track spot when we look to a certain x-value of the plot, since the two tracks are effectively a bit different. Moreover, to refer to small track bumps to align graphs (normal procedure with real data), is not the right way to go here, because the virtual track model is not accurately reproducing also surface roughness and bumps.
Regarding the braking points, it is not easy to do an objective evaluation, because of the mentioned problems with track length and traces alignment. What we see is that there are some small differences between the two cases. We can better analyze this aspect also looking to the following picture showing the Longitudinal Acceleration traces.
Here we see that, probably because of the “real driver” way of braking and also because of the slightly lower downforce level compared to the simulated one, the braking points are slightly different in the two cases, as well as the maximum longitudinal accelerations levels. We are anyway talking about a performance difference of less than 5% (I cannot include the numerical values here, sorry; I guess you have to trust what I say).
Moreover, we have also to consider that the other team driver was able to go up to around the same amount of g produced by the virtual car in the same session and that, anyway, in a simulated environment a driver is normally taking more risks, knowing that in case of mistakes there are nearly no consequences. Anyway, if we consider the second driver braking performance (this is the value used to model the braking system: to “trick” the model so to have a perfect matching in the above picture could be easy, but this is not the scope of this work: I tried to reproduce as close as possible the real car performance basing on real data), the difference between real and simulated model drop to less than 1%.
The same picture shows that also in corner exit accelerations the two traces are practically identical, above all not considering the measuring noise.
It is interesting to see that not only the general shape of the curve is similar in the two cases, but also that the absolute Longitudinal Acceleration values are very close to each other, with differences only where the simulated car was carrying a slightly different speed and was then accelerating from a different RPM level.

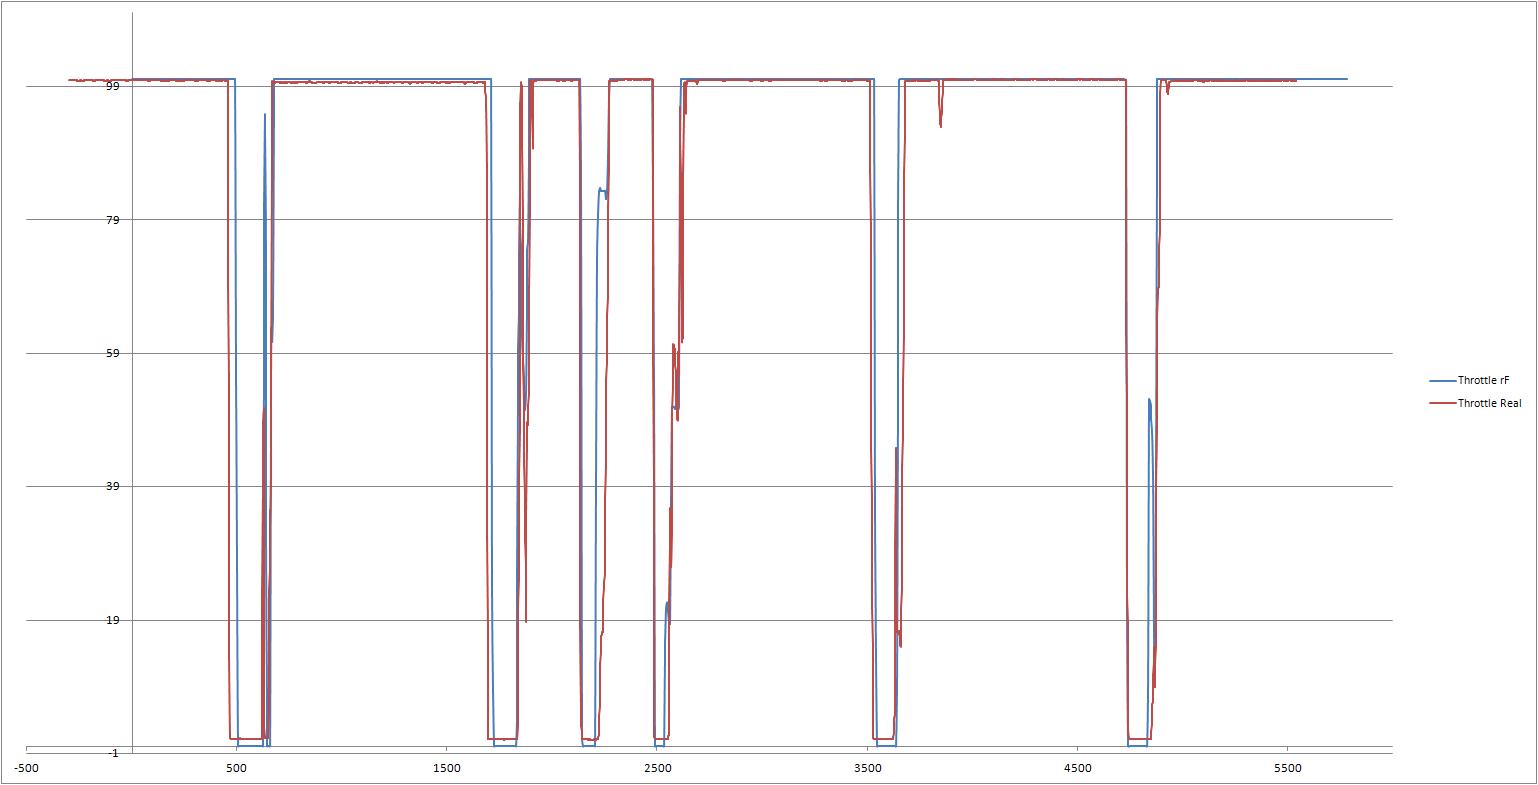
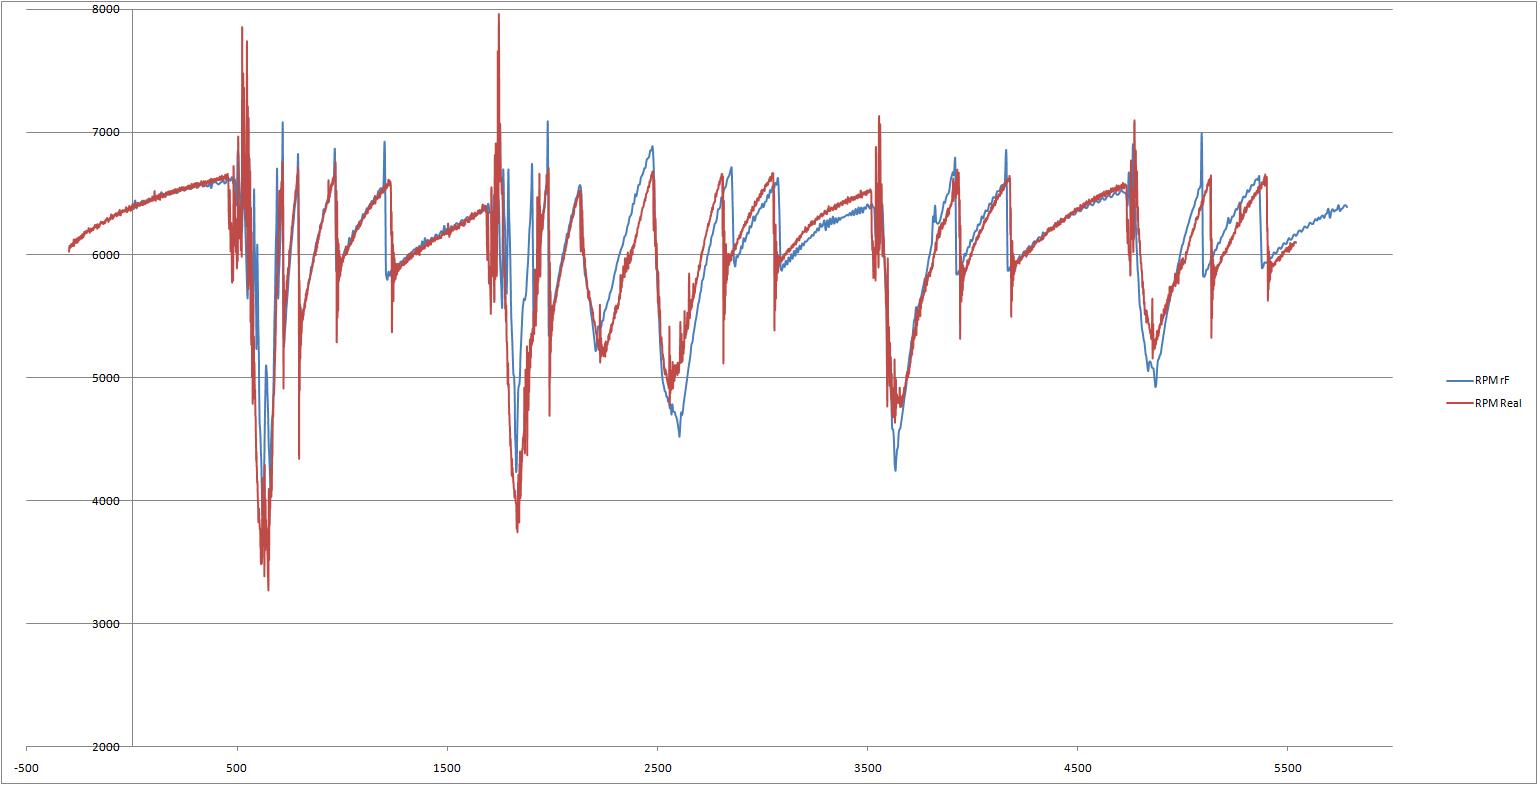
This is further confirmed also looking to the Throttle trace, below and to the RPM picture, immediately after.
The goodness of the simulation output is also confirmed looking to the Lateral Acceleration trace that, together with the Longitudinal Acceleration one, is probably the metric that gives more information about the car handling and vehicle dynamics maximum performance (see picture below).
Here we can see that the maximum g levels of the simulated and the real vehicle are pretty close together at more or less at all speed (downforce) levels.
It is anyway interesting to notice how, also if the speed trace was showing a sensible difference in Lesmo 2 corner (with the vehicle model being slower than the real car), the g trace tells us that the simulated car is reaching the same g level as the real one; this means that the driver is using a different line or that the track model is not perfect in this zone (which is the most realistic scenario, in my opinion).
It’s also interesting to see that where there are discrepancies between simulated and real data, (although, as said, we would expect the driver to take more risks in the simulated environment and so slightly higher g values in this case) it is sometimes the real car to perform better and sometimes the simulated one. This tells, together with the track model accuracy problem said above, that in general the performance envelope of the two vehicle is pretty similar (differences around 4% in the maximum values).

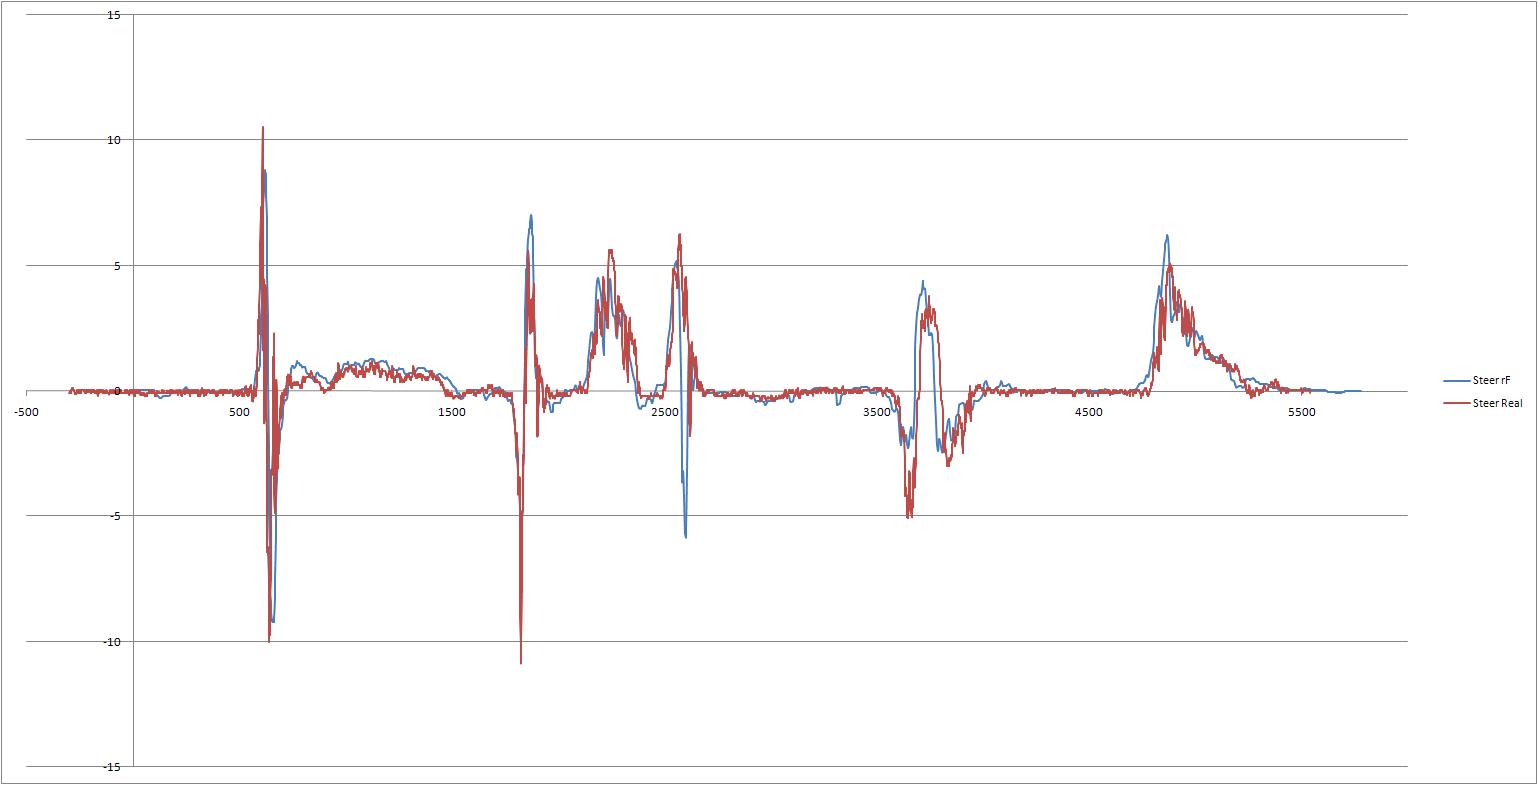
Moreover, if we also take a look to the following steer trace picture, we can see that not only the overall car performance is similar in the simulated and in the real case, but also vehicle balance seems to be very close.
As we said, both models are using the same setup (at least from a mechanical point of view, while we can anyway expect that the differences in the aero configuration are not altering downforce distribution front to rear); having as a result a similar handling balance, means that not only the car itself is behaving in a similar way to the real one, but also that the tire model does his job well, compared to the real tires.
Tires data and tire modeling are probably the most difficult and sensible aspect in vehicle modeling; in driving simulations they have not only the effect of producing the right forces in the interaction between ground and vehicles, but have to also communicate to the driver the right “feeling” about car behavior and its balance.
The tire model used by rFactor has shown to be pretty flexible and allows to reproduce some features that even common automotive standard model don’t always depict.
Using real data coming from Avon (and although lacking detailed info about the longitudinal forces), it has been possible to create a pretty good and reliable tire model for this simulation.
A quick note, out of the scope of this paper, is that also the driver feedback about car behavior and performance was very good, once again confirming the goodness of the model and, more in general, of the simulation environment.
Finally, a very important point to evaluate the mechanical side of the model relies on suspension behavior, since they are one the of most important elements to tune vehicle balance and to adapt it to the driver needs.
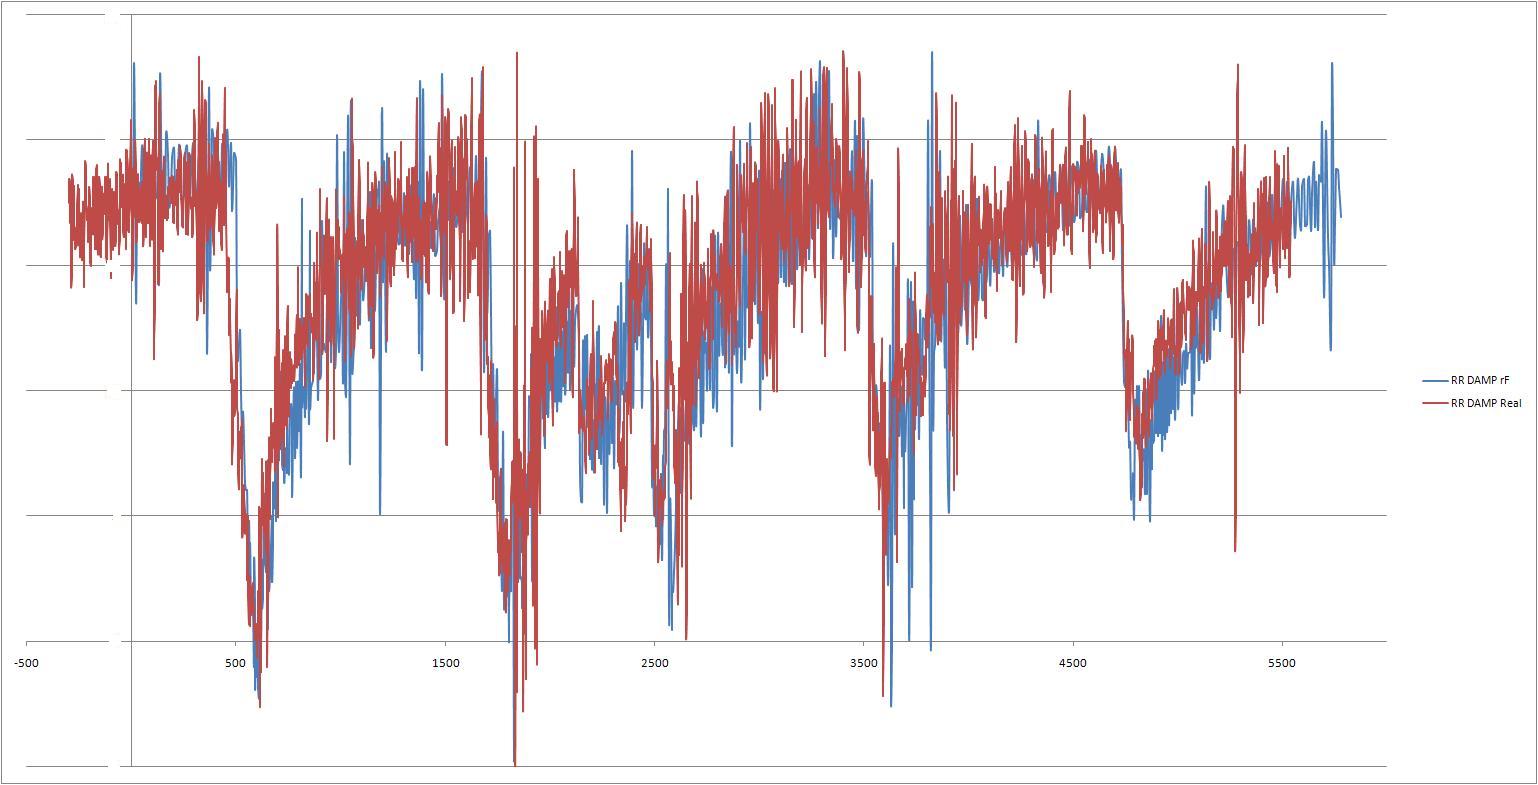
The pictures below show the traces of spring/damper unit movement, again simulated vs. real car.
Once more, it is clear that the general trends are showing a very good match between the two cases, for all of the 4 corners.
Looking to the front first, we can see that, although being the simulated maximum deflection values very close to the real one, at the end of the straights there is a small difference (around 6%) on the average amount of displacement.
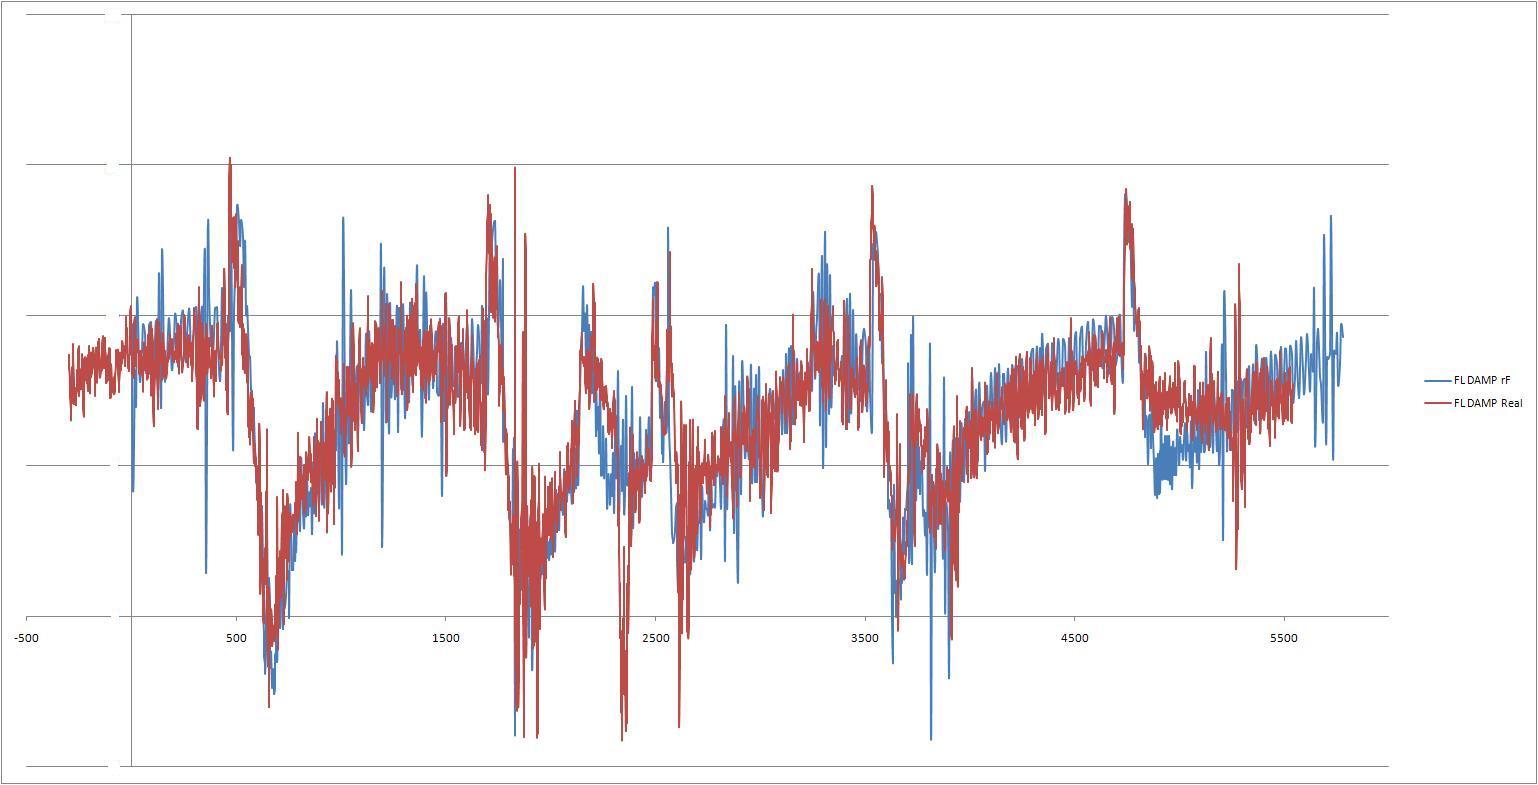
This is probably in part connected to the said difference in downforce between real and simulated vehicle and also to how we reproduced motion ratio inside the simulation: we have in fact assumed Motion Ratio to be constant, while no real suspension respect this condition strictly. Moreover rFactor doesn’t reproduce suspension friction or hysteresis anyhow. They are normally low in race car suspensions, but still not absent. Also, F3 dampers have some internal pressure that creates an effect similar to spring preload, again not simulated in rFactor. Finally, although this probably produce a lower effect, all chassis and suspensions have some compliance, above all at the link attachments to chassis or at damper connections to rocker or tube. Again this is something rFactor dosn’t simulate, as also some of the most professional simulation packages don’t do.
Finally, the data acquisition system in use on the real car allowed to calibrate suspension potentiometers only through two calibration points (and so applying a linearization on the whole movement range); this aspect and the position of the sensor, which was not mounted on the damper body, although being calibrated on damper movement, could have also driven some very small measurement errors.

The real dampers traces show a similar behavior, with a similar behavior to the one described at the front and which is probably connected to the same causes.

The overall behavior of the simulated spring/damper units in his whole is anyway very similar to the real counterparts, with consequently also similar amounts of body roll and antiroll bar deflection.
To sum up, all what we saw proves that, when real and accurate input are used to model vehicles in rFactor, a very good correlation between real car vs. simulated car output data can be achieved.
There are of course some small differences, as we have seen, that are difficult to eliminate without artificially “tricking” the data, but they are in general very small and sometimes not directly connected to the vehicle model, but to the track or to the driver.
Some more investments in track modeling could easily reduce these effects, but it was out of the scope of this for me!
Considering the overall expense requested to buy a similar software (between 30 and 50 euro), it could be seen that the performance vs. cost ratio is still extremely appealing.
Another interesting conclusion is the also the objective and the perceived balance of the simulated car vs. the real one is very close, when accurate data is used (of course here I am not going into the very difficult field of motion platforms and driver cueing, I only talk about driver feeling at the wheel). This has two very useful effect: on one side, it pushes the pilot to drive the vehicle in a very similar way to what he would do on track, enforcing the reliability of the final results; on the other side, it makes in theory possible to evaluate also setup parameters through a driving simulator using rFactor as a software, at least if we know and carefully evaluate the effects of all the assumption done by the code or by ourselves when modeling the vehicle. This is a very important point not to be underestimated, but still something that could be overcome.
By the way, real car lap time: 1.47.3; simulated car lap time 1.47.1.
Although this is not that important, in my opinion


Excellent piece.
By: Chris Partridge on January 4, 2014
at 8:30 pm
Great article.
By: Tim Wheatley on January 4, 2014
at 8:57 pm
Amazing article, thanks!
By: Peter Weiss on January 4, 2014
at 10:08 pm
Very good job mate !
By: Rodrigo Borba on January 4, 2014
at 10:44 pm
I always have asked myself how close to reality is rfactor (2). I am driving in real non professional track races, and I have been split minded about playing rfactor as a simulator – is it good or bad for my real skills 🙂 Thank you for this excellent article.
By: Georgi Iovchev on January 4, 2014
at 11:34 pm
I think this article gets cloest to answering that age old question of whether simulation really is that close to the real thing. By the way, was the software rFactor or rFactor2?
By: chris1603 on January 5, 2014
at 9:01 am
Thanks everybody for your comments and feedback.
It has been very interesting for me to discover how much we could do with such a cheap software!
Of course “condicio sine qua non” is to build up an accurate model relying on accurate data. Every software produce wrong results if the input is wrong.
By the way i use rfactor 1 for all my studies.
By: drracing on January 5, 2014
at 10:20 am
It would be fascinating to see what results can be produced from rFactor 2 — the successor to rF1. It had flexible chassis implemented which might add that extra bit you mention. Plus its tyre more is even more advanced.
By: Chris Partridge on January 5, 2014
at 10:25 am
Very interesting and informative.
I’m bookmarking this for future doubters out there, lol.
Thanks for the time you spent on this and for sharing your findings with us.
By: Butch Nackley on January 5, 2014
at 12:34 pm
Interesting. At Cruden we add motion platforms indeed and physics models that can be external (i.e. Simulink) to add more control, but that ofcourse is much more involved. It does require knowledge/input on parameters for tires, aero and such, and ofcourse validation of simulation vs reality, but in doing so you can get a very useful tool that helps for real life setting up as well.
By: Ruud van Gaal on January 6, 2014
at 11:43 am
It would indeed be interesting to model also other parameters like chassis/attachments stiffness, but to be totally honest i don’t know how much the results would improve compare to the additional effort that you have to produce to incorporate these features and, probably even more difficult, to measure or obtain them from a manufacturer.
Normally, good racecars have pretty stiff chassis, so their compliance should be pretty low. Should be….at least! In my experience this is not always the case!
To model such a feature would surely be interesting and challenging, so it could be also funny! I am just not sure how big could be the difference in the results, compared to an easier model like rFactor one. I guess to know the answer we should try!
Anyway, i have never tried rFactor2 yet, so i cannot really judge how good it is, in general.
Ruud, thank you very much for your contribution, it is really a pleasure and an honor to read you here.
I am of course not doing simulations at Cruden level, this is just a very interesting hobby for me at the moment.
I know you are working both on controls / motion platforms and on the software side; Cruden is one of the best recognized company for professional driving simulator, so it is really helpful to have your feedback!
It would be really interesting to know how different / more complicated is the software you use for your professional customers compared to a commercial one, like rFactor or even your free one, Racer.
By: drracing on January 6, 2014
at 1:26 pm
Thanks for the kind words. 🙂
If your signals are already within 5% of the measured signal, there’s only 5% to gain with extra parameters. Depends on on what level you simulate ofcourse if you want to add such details, ofcourse not coming at an extra 5% CPU cost but often more.
I don’t really know rFactor’s physics that well, I presume rFactor1 may convert suspension geometry to lookup tables internally to avoid joint solving. Racer itself doesn’t use joints internally, and it still goes a long way to simulate a car. For more subtle behavior we have solutions to run physics locally (a compiled model) or on the network. That base model does use joints solving, but customers can tweak and add to the model, as long as it runs in realtime. There is always a model though, as long as computers have finite power. Still, with very stiff components it’s sometimes hard to get those integrated nicely. That’s why validation is required to be able to figure out if you’re not introducing resonancies that are a result of integration, rather than physical (expected) behaviors.
We don’t use Racer’s internal physics engine for any of our Pro customers though, since the aim is to provide customers more flexibility.
By: Ruud van Gaal on January 7, 2014
at 1:08 pm
Remember too there might be an even closer correlation between RL and rF physics as the track properties are unlikely to be exactly the same, ie it is v unlikely there is exactly the same amount of grip and abrasiveness.
By: chris1603 on January 14, 2014
at 8:09 am
Chris,
this is a very good point, as i mentioned in my post the track model is the one provided with rF under the name “Brianza”.
The layout doesn’t look perfect and, for sure, bumps and dips are not on the spot as well.
I guess that with laser scanned tracks it could be definitely possible to close part of the gap i still had.
It is a bit more difficult to reproduce how track grip changes along the track, i guess, but having the track surface and layout properly reproduced could give already a very very good insight, in my opinion.
By: drracing on January 14, 2014
at 8:24 am
What is the max g value in your charts for F3: ~2g or 3g?
Did the sim racing dirver actually drove a 3DoF motion simulator or a stationary rig? This study is very interesting.
By: Joe on January 15, 2014
at 4:00 am
Thanks for your feedback.
Sorry, but i am not willing to share that infos. All the numbers that are not shown are not for a reason!
The study was done using a normal home driving rig, with a Logitech steering wheel and pedal.
Unfortunately i have no access to motion platforms or expensive rigs.
By: drracing on January 15, 2014
at 5:26 pm
Thanks for your reply. You may add Gear-shift charts to overlay with the Speed and RPM charts.
On the suspension DAMP Charts, I see that general trends look good but details just not close to real car. I can see the rF is mainly simple lower fundemantal freq while real car showed far more complex spectrum.
I guess the rF1 Spring/Damper model is too “simple” or the track surface is just not that detail to reflect their model.
However, I tried rF2 cars, I feel more details of surface vibrations than rF1. It could be rF2 is better in this regard.
Can you share what the tool and plugin you used to store the rF Telemetry data?
Thanks again, great work indeed!
By: Joe on January 17, 2014
at 3:37 pm
Love this article.
It proves a lot of the doubters completely wrong – I know I’ll be showing this to quite a few people.
By: laura on January 17, 2014
at 11:16 am
Laura, thanks for the kind words.
Joe, i think you didn’t read carefully what i said in my post: the track model is not something done on purpose for this study, but simply what was given together with rFactor.
Of course, since the track is not (at least as far as i know) laser scanned, its surface is not identycal to the real one, nor anybody was expecting so.
Laser scanned tracks can cost, as an end product, up to several thousand euros; my article is coming from a private intiative to verify how rFactor performs compared to a real car.
The point of this study was not to check if every single bump was affecting virtual model behavior as it was doing with the real car, but simply to verify if the trends are close. And, in my opinion, they are.
There is no point in discussing how the damper/spring model is built, we are always talking about a simulation, not about the real thing. Every single channel I showed is coming from a finite calculation, as it is in every simulation package.
To properly simulate dampers is a complex matter, sometimes hard also for very expensive, professionals software like ADAMS.
I didn’t expect a 30 euros software to be the final answer about that, even with a perfect track model.
By: drracing on January 17, 2014
at 5:35 pm
Andrea:
Thanks for clarification. I should have read carefully.
The “Trend” of DAMP on each corner indeed pretty close to that of real car, although some huge sparks diff, which I will guess due to the driver hit side way or apx, etc, while other drive did not.
Aside from the aspect of surface textrue of track, I think the rF1 damp/spring model could be “faulty”. For rF1, if I sping off the road and run over side way…. my car bounced up down like a boat on water wave — just unrealistic (lack of higher modes of Sinusoidal Frequency Response). For rF2, this is not the case. it is many times better and far more realistic.
iRacing’s tracks are actually laser scanned, but I doubt if that even matter, since both rRacing and rFactor interface rate is 60 Hz. the fastest response is 16.7 ms. If the SW can real-time updated in 16.7ms still cannot caputure the surface details in such high speed of racing.
By: Joe on January 17, 2014
at 8:59 pm
@Joe, actually that information (rF vehicle inputs at 60 Hz) is WRONG. From v1150 onwards, vehicle inputs are read on a thread at over 100 Hz. Couple that with the engine tick rate at 400Hz (compared to Iracing’s 360 Hz) and tires detect enough detail caught on the surface at high speed. What I and others contend is that all the millimetre precision by laser scanned tracks is somewhat an overkill with physics engines that work at significantly lower rates than LFS’s tire dynamics (2000 Hz). But then, as Ruud knows, there’s still a lot we can do with such tick rates in regards to prediction, so maybe it’s not that serious a flaw.
Also, I never noticed the bouncing of the car upon springing off road and “sideways”. Again, it all depends on the calibration you imposed through the hdv and tbc files.
@Ruud,
to my knowledge, there’s no lookup tables involved in suspensions on rFactor. If there were, I’d imagine it would increase significantly the weight of the executable (the only possible place, considering there’re no suspension lookup tables exposed in physics files) if ISI intended for all the rF suspension models to be effectively modelled. Maybe Tim could (if this is not somehow ISI-confidential) clarify this.
@Andrea, another good article. It has spawned a few heated debates at several forums, which has its positive side.
By: Miguel Margarido on January 17, 2014
at 10:22 pm
Miguel:
Thanks for your response. If rF cars’ input rate > 100 Hz, then what are the min USB rate is required?
My pedals, steering wheel, shifter, and motion seat/platform are all interfacing via USBs to PC. My monitors (TVs) set to 60Hz fresh rate now.
By: Joe on January 18, 2014
at 1:38 pm
@Miguel,
Thanks for your contribution. Very apreciated! Your inputS are always interesting and full of useful insights.
@Joe,
I would like to keep the discussion focused on vehicle dynamics and on modeling.
My post was not about motion platforms.
Also, to be honest, i don’t think you can draw the conclusion you drew only by looking to the damper traces. As Miguel said, model bahavior depends a lot on how you build it.
Moreover i think that car handling on the grass is not as intetesting as car handling on track, don’t you think?
By: drracing on January 18, 2014
at 3:17 pm
Andrea:
I totally understand your concern and point here. Most people probably would not be interesting on motion seat/platform in this regard.
To me, the steering wheel feel and visual effects on monitor are not that important as motion platform, and honestly if we talk physics in that level, it all matters on motions. Your all Telemetry data feed to a simulator is all about motion: g-force, speed, bump, impacts, shaking, etc. Anyhow, aside from this, I got to ask following question for you and Miguel:
Miguel mentioned that rF cars’ input rate is > 100 Hz. How about the car “output” rate? I was told output rate is 60Hz. This is particularly important to me, on my motion setup and TVs.
thanks again,
Joe
By: Joe on January 18, 2014
at 4:28 pm
@Joe,
I don’t know exactly at which frequency motion platforms signal are fed. But data logging can measure at least up to 100hz as far as i remember. Maybe even 200 hz.
By: drracing on January 18, 2014
at 6:20 pm
rFactor physics update rate is 400MHz.
By: chris1603 on January 20, 2014
at 10:23 am
Chris,
Thanks a lot for this info.
By: drracing on January 20, 2014
at 10:31 am
@Joe, @drracing, the engine tick-rate of rFactor is 400 Hz indeed. Members of the Telemetry class (rF internals Plugin ) are refreshed every frame produced (and no higher than 90 FPS).
As for motion platform realtime physics updates, to my knowledge,the API’s of several known motion platforms provide methods which return or allow access to info/data for chassis/suspension movement and linear/angular velocity/acceleration of the car and tyres, and these methods are to be called at the same frequency as screen frame-updates.
Hope this contributes a little to this side-bar topic – not my intention to deviate comments from the author’s article.
By: Miguel Margarido on January 21, 2014
at 5:06 pm
Interesting stuff, thanks for the information and research.
By: Covase on January 23, 2014
at 2:51 pm
Fantastic Article,
I have really enjoyed reading this performance test you have produced here.
I am writing a report very similar to this and I have to say it has helped me a great deal (although I am mainly focusing on reproducing tyre models within rFactor), I am very curious by how you have managed to transfer your own real tyre data to within the simulator and use it with the car simulated.
So far I have found an original rFactor tyre model file called JF3_tires.tbc (Not sure if the correct file needed), I also have tyre data from Avon’s F3 tyres containing Lateral forces and Self Aligning Torque. I am however unaware of how to begin inserting this data for my own use?
If there is any chance you might be able to help me with this issue I would be extremely grateful.
Thanks,
Andrew
By: Andrew Wilson on March 27, 2014
at 8:41 pm
Andrew,
thanks for your kind words.
Tire modeling is surely among the most difficult thing (if not the hardest one) when dealing with driving simulation, not only because it directly affects vehicle performance and behavior but also because it is something that has to create the right feeling for the driver/user (or at least the closest possible resemblance to the real car/tire behavior).
Tire modeling in rFactor is pretty complex, since rF tire model is pretty flexible and allows you to do many interesting things. Of course, it has also its drawbacks, it is at the end still a model and has some weaknesses that limits your action range, but still i think you can obtain very good correlation out of it.
I and many other people who use rFactor for our studies/simulation/work have created spreadsheets or small software to model tires, among other things, basing on real tire data, when available. Normally they are given as pacejka coefficients, as you mentioned, with all the approximations connected with this modeling approach.
It is difficult to share here these kind of information, but you can find some very good material around the web. Sometimes, you will also need to test something yourself, to be sure you are modeling a certain phenomenon right.
At the end, anyway, you will always need a validation phase (above all when you can rely on track data) to be sure that your model is behaving as closely as possible to the real car. Eventually, you will also have to fine tune some parameters to correct for wrong/ approximated data.
What is the purpose of your work? Are you doing it only for fun or you are working on something more serious?
By: drracing on April 10, 2014
at 1:54 pm
I also think Rfactor is good as performance simulator. Our experience is that we have made a physical mod to try a realistic approach to 2013 formula 1 figures. We are not proffesionals, not very experienced either, many parameters were set empirically, and in the begining we really didn’t expect a good accuracy.
However, after collecting various competition results, speeds were surprisingly close to real ones on the most of tracks, and this is impossible without a very good management of weights, power, aerodynamics, etc by Rfactor inside motor.
If you are interested, the statitistic were published here :
http://isiforums.net/f/showthread.php/16525-F1LRclub-VCR?p=325211#post325211
By: Rain on December 13, 2014
at 4:44 pm